Australia Application Security Market Size, Share, Report 2026-2034

Australia Application Security Market Overview

The Australia application security market is experiencing robust growth, driven by escalating cyber threats, sweeping regulatory reforms, and the rapid expansion of cloud-native and mobile application environments across Australian enterprises. According to IMARC Group, the Australia application security market size reached USD 159.1 Million in 2024. Looking forward, IMARC Group expects the market to reach USD 575.4 Million by 2033, exhibiting a growth rate (CAGR) of 14.2% during 2025-2033.

Australia’s application security landscape has been fundamentally reshaped by a wave of landmark cybersecurity legislation that is creating unprecedented compliance obligations and driving enterprise investment in security tools and services. The Cyber Security Act 2024, which received Royal Assent on November 29, 2024, introduced mandatory ransomware and cyber extortion payment reporting obligations effective from May 30, 2025, and mandated security standards for smart devices taking effect from March 4, 2026. Concurrently, amendments to the Security of Critical Infrastructure Act 2018 (SOCI Act) confirmed that organizations responsible for critical infrastructure assets must ensure risks to data essential to asset operation are addressed within their Critical Infrastructure Risk Management Programs, with mandatory cyber incident notification within 12-72 hours. The Australian Signals Directorate reported an 11% increase in cyber incidents in its 2024-25 Annual Cyber Threat Report, underscoring the intensifying threat environment that is compelling organizations to invest in comprehensive application security solutions.

The market is further propelled by the accelerating digital transformation across Australian industries, which is expanding the attack surface that application security solutions must protect. The explosive growth of cloud-native applications, microservices architectures, APIs, and mobile applications creates increasingly complex software environments requiring sophisticated security testing and runtime protection capabilities. As enterprises adopt DevSecOps methodologies that embed security testing into continuous integration and continuous deployment (CI/CD) pipelines, the demand for automated application security testing tools, including Static Application Security Testing (SAST), Dynamic Application Security Testing (DAST), Interactive Application Security Testing (IAST), and Runtime Application Self-Protection (RASP), is expanding rapidly across organizations of all sizes.

How AI is Reshaping the Future of the Australia Application Security Market

Artificial intelligence is fundamentally transforming the Australian application security market by enabling faster threat detection, reducing false positive rates, automating vulnerability remediation, and creating an ongoing arms race between AI-powered defense systems and AI-augmented cyberattacks. AI technologies are becoming indispensable to modern application security strategies as the volume and sophistication of threats outpace human analytical capabilities.

  • AI-Powered Vulnerability Detection and Prioritization: Machine learning models are revolutionizing application security testing by analyzing source code, application behavior, and network traffic patterns to identify vulnerabilities with far greater accuracy and speed than traditional rule-based scanners. These AI systems can contextualize vulnerabilities based on exploitability, business impact, and attack likelihood, enabling security teams to prioritize remediation efforts on the most critical issues rather than drowning in alerts. Australian enterprises are increasingly deploying AI-enhanced SAST and DAST tools that learn from historical vulnerability data to reduce false positives by up to 90%, dramatically improving developer productivity and security team efficiency.
  • Automated Code Remediation and Secure Coding Assistance: Generative AI is being integrated into application development workflows to provide real-time secure coding suggestions, automatically generate security patches for identified vulnerabilities, and review code changes for security implications before they enter production. These AI-powered code assistants help developers write more secure code from the outset, shifting security left in the software development lifecycle and reducing the cost of remediation by catching vulnerabilities during development rather than in production environments.
  • AI-Driven Runtime Application Self-Protection (RASP): Next-generation RASP solutions powered by machine learning are providing Australian organizations with intelligent runtime protection that can detect and block zero-day attacks, injection attempts, and anomalous application behavior in real time without requiring prior knowledge of specific attack signatures. These AI-driven RASP systems continuously learn from application behavior patterns and adapt their protection strategies, providing defense against novel attack vectors that would evade traditional signature-based security tools.
  • AI-Enhanced API Security and Bot Management: As Australian enterprises expose increasing numbers of APIs to power digital services, mobile applications, and partner integrations, AI is becoming essential for securing these interfaces. Machine learning algorithms analyze API traffic patterns to distinguish legitimate usage from malicious exploitation, detect credential stuffing attacks, identify data exfiltration attempts, and block automated bot traffic. AI-powered API security platforms can discover shadow APIs that organizations may not even know exist, map data flows, and enforce security policies across complex API ecosystems.
  • AI in Threat Intelligence and Attack Prediction: AI-powered threat intelligence platforms are aggregating and analyzing global threat data to predict emerging attack vectors targeting Australian applications before they materialize. These systems correlate dark web intelligence, vulnerability disclosures, exploit development activity, and regional threat actor behaviors to generate actionable intelligence that enables proactive security posture adjustments. The integration of AI threat intelligence with application security tools creates a predictive defense capability that moves organizations from reactive incident response to anticipatory threat mitigation.

Request a Business Sample Report for Procurement & Investment Evaluation:

https://www.imarcgroup.com/australia-application-security-market/requestsample

Australia Application Security Market Trends

Regulatory-Driven Security Investment Acceleration

Australia’s rapidly evolving cybersecurity regulatory landscape is creating an imperative for organizations to significantly increase their application security investments. The Cyber Security Act 2024 established mandatory ransomware payment reporting effective May 30, 2025, while mandating security standards for smart devices from March 4, 2026. The SOCI Act amendments require critical infrastructure operators to integrate data security risks into their Critical Infrastructure Risk Management Programs with mandatory incident notification within 12-72 hours. Privacy Act amendments introduced civil penalties for serious privacy invasions from June 10, 2025, and will require transparency around substantially automated decisions from December 10, 2026. These overlapping regulatory requirements are creating a compliance-driven investment cycle where organizations must deploy comprehensive application security testing, monitoring, and incident response capabilities to meet their obligations across multiple regulatory frameworks. The cumulative effect is transforming application security from a discretionary IT expense into a board-level risk management priority, particularly for organizations operating in regulated sectors such as critical infrastructure, financial services, healthcare, and government.

DevSecOps Adoption and Shift-Left Security Integration

The adoption of DevSecOps practices is accelerating across Australian organizations as enterprises recognize that securing applications after deployment is increasingly inadequate against modern threat landscapes. DevSecOps integrates security testing and controls directly into the software development lifecycle, embedding SAST, DAST, Software Composition Analysis (SCA), and container security scanning into CI/CD pipelines so that vulnerabilities are identified and remediated during development rather than discovered in production. This shift-left approach is driving demand for automated security testing tools that can operate at developer speed without creating bottlenecks in rapid release cycles. Australian enterprises are investing in integrated application security platforms that provide a unified view of vulnerabilities across the entire software stack, from custom code and open-source components to APIs and cloud infrastructure configurations. The cultural transformation required for DevSecOps adoption is also creating demand for security training, secure coding education, and security champion programs that upskill development teams to take ownership of application security within their workflows.

Australia Application Security Market Summary

The following bullet points provide a quick summary of the key insights from the Australia application security market report:

  • Market Size (2024): USD 159.1 Million
  • Market Forecast (2033): USD 575.4 Million
  • CAGR (2025-2033): 2%
  • Key Growth Drivers: Escalating cybersecurity regulatory requirements under the Cyber Security Act and SOCI Act, rapid DevSecOps adoption embedding security into CI/CD pipelines, growing cloud-native and API-driven application environments, rising sophistication of cyberattacks targeting Australian organizations, and increasing AI integration into security testing and runtime protection.
  • Major Industry Players: CrowdStrike, Palo Alto Networks, Fortinet, Checkmarx, Snyk, Veracode, Synopsys, Rapid7, CyberCX, and Tesserent (Thales Group).

Australia Application Security Market Growth Drivers

Escalating Cyber Threat Landscape and Data Breach Costs

The intensifying cyber threat landscape facing Australian organizations is a primary driver of application security market growth, as the Australian Signals Directorate reported an 11% increase in cyber incidents in its 2024-25 Annual Cyber Threat Report. Application-layer attacks, including SQL injection, cross-site scripting, API exploitation, and supply chain compromises through vulnerable open-source components, represent a growing proportion of successful breaches targeting Australian organizations. The financial impact of data breaches continues to escalate, with organizations facing not only direct remediation costs but also regulatory penalties under the enhanced Privacy Act, reputational damage, and potential class action litigation. High-profile breaches affecting major Australian organizations in recent years have elevated board-level awareness of application security risks, transforming security investment decisions from technical IT matters into enterprise risk management priorities. This heightened threat awareness, combined with the tangible financial consequences of application-layer breaches, is compelling organizations across all sectors to invest in comprehensive application security testing, monitoring, and protection capabilities.

Cloud Migration and API Economy Expansion

The accelerating migration of Australian enterprises to cloud-native architectures and the explosive growth of API-driven digital ecosystems are fundamentally expanding the application attack surface and driving demand for modern application security solutions. As organizations decompose monolithic applications into microservices, deploy containerized workloads on Kubernetes platforms, and expose APIs to power mobile applications, partner integrations, and digital commerce, the complexity of securing these distributed application environments grows exponentially. Traditional perimeter-based security approaches are ineffective in protecting cloud-native applications where the concept of a fixed network boundary has dissolved. Australian organizations are investing in cloud-native application protection platforms (CNAPP) that integrate cloud security posture management, workload protection, container security, and API security into unified platforms. The API economy is creating particularly acute security challenges, as each API endpoint represents a potential attack vector that must be discovered, monitored, and protected. The convergence of cloud migration and API proliferation is driving sustained demand for next-generation application security tools designed for modern, distributed software architectures.

Australia Application Security Market Segments

The Australia application security market report provides a detailed breakup and analysis of the market based on various segments:

Breakup by Component: Solutions and Services.

Solutions constitute the larger segment of the Australian application security market, encompassing the software tools and platforms that organizations deploy for vulnerability detection, security testing, and runtime protection. This includes SAST, DAST, IAST, RASP, SCA, and web application firewall (WAF) products. Services complement solution deployments and include managed security services, consulting and advisory, integration and implementation, and training and education. The services segment is growing rapidly as organizations, particularly mid-market enterprises lacking in-house security expertise, increasingly rely on managed application security testing and security-as-a-service offerings to address their compliance and protection requirements.

Breakup by Testing Type: Static Application Security Testing (SAST), Dynamic Application Security Testing (DAST), Interactive Application Security Testing (IAST), and Runtime Application Self-Protection (RASP).

SAST holds a significant market share by analyzing source code for vulnerabilities during the development phase, enabling early detection and cost-effective remediation. DAST complements SAST by testing running applications from the outside to identify vulnerabilities that only manifest during execution, such as authentication flaws and server configuration errors. IAST combines elements of both approaches by instrumenting applications during testing to provide real-time vulnerability identification with precise code-level context. RASP is the fastest-growing testing type, embedding security controls directly within applications to detect and block attacks in real time during production, providing a critical last line of defense against zero-day exploits and sophisticated application-layer attacks.

Breakup by Deployment Mode: On-Premises and Cloud-Based.

Cloud-based deployment is the fastest-growing mode in the Australian application security market, driven by the broader cloud migration trend, the scalability advantages of SaaS-delivered security tools, and the reduced infrastructure management burden compared to on-premises solutions. Cloud-based application security platforms offer rapid deployment, automatic updates, elastic scaling for large codebases, and seamless integration with cloud-hosted CI/CD pipelines. On-premises deployment remains preferred by organizations in highly regulated sectors such as defense, government, and financial services where data sovereignty requirements, security classification policies, or existing infrastructure investments favor locally hosted solutions.

Australia Application Security Market Competitive Landscape

The competitive landscape of the Australia application security market features a mix of global cybersecurity leaders, specialized application security vendors, and established Australian security service providers. CrowdStrike and Palo Alto Networks have expanded their application security capabilities through platform consolidation strategies, integrating application protection into broader cybersecurity platforms that address endpoint, cloud, and network security. Fortinet competes across multiple security domains with its Security Fabric architecture. Specialized application security vendors including Checkmarx, Snyk, Veracode, and Synopsys (now part of Clearlake Capital) offer dedicated application security testing platforms with deep expertise in SAST, DAST, SCA, and container security. Rapid7 provides integrated vulnerability management and application security testing capabilities. Among Australian players, CyberCX has emerged as the nation’s largest independent cybersecurity services company, offering managed application security testing and advisory services across the enterprise market. Tesserent, now part of the Thales Group, provides managed security services and application security consulting to Australian organizations. The market is also witnessing growing activity from cloud security posture management vendors and API security specialists that are addressing the unique requirements of cloud-native application environments.

Latest News and Development in the Australia Application Security Market

The following are some of the latest news and developments shaping the Australia application security market:

  • May 2025: The mandatory ransomware and cyber extortion payment reporting obligation under the Cyber Security Act 2024 took effect on May 30, 2025, requiring certain businesses to report ransom payments to the Australian Signals Directorate, increasing transparency around application-layer attacks and driving investment in preventative security measures.
  • June 2025: Civil penalties for serious invasions of privacy under the amended Privacy Act 1988 came into force on June 10, 2025, creating additional financial incentives for organizations to invest in robust application security to protect personal data from breaches and unauthorized access.
  • 2024-2025: The Australian Signals Directorate’s Annual Cyber Threat Report for 2024-25 revealed an 11% increase in cyber incidents reported to ASD, highlighting the growing sophistication of application-layer attacks targeting Australian organizations across critical infrastructure, government, and commercial sectors.
  • November 2024: Amendments to the Security of Critical Infrastructure Act 2018 (SOCI Act) came into effect, requiring critical infrastructure operators to address data security risks within their Critical Infrastructure Risk Management Programs and maintain mandatory cyber incident notification capabilities within 12-72 hours.
  • March 2026 (Upcoming): Mandatory security standards for smart devices under the Cyber Security (Security Standards for Smart Device) Rules 2025 are set to take effect on March 4, 2026, expanding application security requirements to connected consumer devices and IoT ecosystems sold in Australia.

Note: If you require any specific information not currently covered within the scope of the report, IMARC Group will provide it as part of customization.

Speak to an analyst:

https://www.imarcgroup.com/request?type=report&id=33465&flag=E
Australia Smart Homes Market 2026| Worth USD 11.54 Billion by 2034

Australia Smart Homes Market Overview

The Australia smart homes market is experiencing rapid expansion as connected technologies transform the way Australians live, manage energy, and secure their properties. Smart homes integrate Internet of Things (IoT) devices, artificial intelligence, voice assistants, and automated systems to enable centralized control of lighting, heating and cooling, security, entertainment, energy management, and appliances through smartphones, voice commands, or autonomous routines. Australia’s unique combination of high broadband penetration, world-leading residential solar adoption, rising energy costs, and a tech-savvy consumer base creates an exceptionally fertile environment for smart home technology adoption. With over 45% of Australian households having adopted at least one smart home device by mid-2025, the market has transitioned from an early-adopter niche to a mainstream consumer category, driven by growing demand for convenience, energy efficiency, enhanced security, and sustainable living.

The Australia smart homes market size reached USD 4.29 Billion in 2025. Looking forward, the market is expected to reach USD 11.54 Billion by 2034, exhibiting a growth rate (CAGR) of 11.64% during 2026-2034. This strong double-digit growth trajectory is being fueled by the widespread adoption of the Matter universal connectivity standard that unifies previously fragmented ecosystems, integration of generative AI into voice assistants for more intuitive home control, rising residential energy costs driving demand for smart energy management, government cybersecurity initiatives establishing baseline IoT device standards, and the growing availability of affordable smart home products across retail and online channels.

Read more about Australia Smart Homes Market:

https://www.imarcgroup.com/australia-smart-homes-market/requestsample

How AI is Reshaping the Future of Australia Smart Homes Market

Artificial intelligence is the single most transformative force in the evolution of smart homes, shifting the paradigm from simple device automation to truly intelligent living environments that anticipate, learn, and adapt to occupant needs. In Australia, the integration of generative AI and machine learning into smart home platforms is accelerating rapidly, with major technology companies deploying increasingly sophisticated AI capabilities that fundamentally change how residents interact with their homes.

  • Generative AI-Powered Voice Assistants and Contextual Control: Google’s Gemini for Home, rolling out to Australian households starting late 2025, represents a generational leap in smart home intelligence. Unlike traditional command-response voice assistants, Gemini enables conversational, context-aware control—understanding natural language requests, remembering user preferences, and proactively suggesting actions based on routines, weather, and occupancy patterns. Amazon’s Alexa+ paid AI assistant, powered by the new AZ3 AI chip in Echo devices, delivers similar local processing capabilities for real-time smart home control.
  • AI-Driven Energy Optimization and Cost Reduction: Machine learning algorithms are enabling smart energy management systems to analyze household consumption patterns, solar generation forecasts, grid tariff structures, and weather data to autonomously optimize energy usage and minimize electricity bills. In Australia—where residential solar penetration is among the world’s highest and time-of-use electricity pricing is widespread—AI-powered energy systems dynamically schedule high-consumption appliances during low-tariff or peak solar periods, manage battery storage charge/discharge cycles, and reduce grid dependence.
  • Predictive Home Maintenance and Appliance Health Monitoring: AI systems are monitoring the performance of connected home appliances—HVAC systems, water heaters, washing machines, and refrigerators—to detect anomalies, predict failures, and schedule maintenance before breakdowns occur. These predictive capabilities reduce repair costs, extend appliance lifespan, and prevent inconvenient disruptions, creating tangible value that drives consumer adoption of smart home ecosystems.
  • Intelligent Security and Anomaly Detection: AI-enhanced security cameras and sensor networks are moving beyond simple motion detection to intelligent scene understanding—distinguishing between family members, delivery personnel, pets, and potential intruders using computer vision and facial recognition. These systems learn normal activity patterns for each household and generate alerts only for genuine anomalies, dramatically reducing false alarms while improving threat detection accuracy.
  • Cross-Brand AI Intelligence via Matter Protocol: The adoption of Matter 1.5 and Thread 1.4 networking standards has enabled AI platforms to orchestrate devices from different manufacturers within a unified intelligent ecosystem. Google’s AI can now provide sophisticated summaries of home events across different device brands—such as detecting a package delivery on a Nest camera and automatically activating a third-party smart light—creating seamless, intelligent automation that was previously impossible in fragmented ecosystems.

Request a Business Sample Report for Procurement & Investment Evaluation: https://www.imarcgroup.com/australia-smart-homes-market/requestsample

Australia Smart Homes Market Trends

Matter Protocol Unifying Fragmented Smart Home Ecosystems

The release and widespread adoption of the Matter 1.5 and Thread 1.4 networking standards represents a watershed moment for the Australian smart home market, effectively dismantling the interoperability barriers that have long fragmented the industry. Previously, consumers faced the frustrating reality of devices locked into incompatible ecosystems—Apple HomeKit, Google Home, Amazon Alexa, and Samsung SmartThings each operating as separate silos. Matter has unified these platforms under a single connectivity standard, enabling any Matter-certified device to work seamlessly across all major ecosystems. For Australian consumers, this means unprecedented freedom to mix and match devices from different brands without compatibility concerns, significantly lowering the barrier to building comprehensive smart home systems. Apple, Amazon, and Google have all embraced the unified mesh networking standard, with Amazon’s October 2025 launch of Echo devices featuring the AZ3 AI chip specifically designed for Matter 1.5 local processing. The interoperability revolution is accelerating adoption among mainstream consumers who previously avoided smart home technology due to ecosystem lock-in fears, and is expected to drive substantial market growth through 2026 and beyond.

Smart Energy Management Driven by Rising Electricity Costs and Solar Integration

Australia’s rising residential electricity prices and the nation’s world-leading rooftop solar adoption are creating powerful demand for smart energy management systems. With over 3.6 million Australian homes equipped with rooftop solar panels and household battery storage installations growing rapidly, smart energy platforms that optimize the interplay between solar generation, battery storage, grid consumption, and appliance scheduling have become essential household infrastructure. The Australian government’s ‘Solar Sharer’ programme, launching in 2026, will require energy retailers to offer households with smart meters at least three hours of free solar-generated electricity during midday—further incentivizing smart meter and smart energy system adoption. Smart thermostats are gaining particular traction in Australia’s varied climate zones, from tropical Queensland to temperate Tasmania, enabling households to optimize heating and cooling schedules based on occupancy patterns, weather forecasts, and time-of-day electricity rates. The convergence of smart energy management with electric vehicle home charging infrastructure is creating additional demand for intelligent load management systems that balance household energy needs with EV charging requirements.

Australia Smart Homes Market Summary

  • Market Size (2025): USD 4.29 Billion
  • Market Forecast (2034): USD 11.54 Billion
  • Growth Rate (CAGR 2026-2034): 64%
  • Smart Home Device Penetration (mid-2025): Over 45% of Australian households
  • Key Growth Categories: Smart Security, Voice Assistants, Energy Management, Smart Lighting, Climate Control

Australia Smart Homes Market Growth Drivers

High Broadband Penetration and Expanding IoT Infrastructure

Australia’s extensive broadband infrastructure, anchored by the National Broadband Network (NBN) and expanding 5G coverage, provides the essential connectivity backbone for smart home adoption. Reliable, high-speed internet is a prerequisite for the real-time communication, cloud processing, and remote access that smart home devices require, and Australia’s mature broadband landscape ensures that the vast majority of households can support multi-device smart home ecosystems without connectivity constraints. The rollout of Wi-Fi 6E and Wi-Fi 7 routers is further enhancing in-home wireless performance, supporting the growing density of connected devices in smart households. Australia’s high smartphone penetration—exceeding 90%—ensures that nearly all consumers have the mobile interface needed to control and monitor their smart home systems. The deployment of Thread mesh networking, integrated into the Matter standard, is creating robust local device networks that maintain functionality even when internet connectivity is interrupted, addressing a key reliability concern for Australian consumers in regional areas.

Growing Security Concerns and Smart Surveillance Adoption

Rising property security concerns among Australian homeowners are driving strong adoption of smart security systems, which have become the primary entry point for many households entering the smart home ecosystem. Smart locks, video doorbells, motion-activated cameras, window and door sensors, and integrated alarm systems that send real-time alerts directly to smartphones have transformed residential security from passive physical deterrents to active, intelligent monitoring networks. The affordability and ease of installation of modern smart security products—many requiring no professional installation or wiring—has dramatically expanded their appeal beyond affluent early adopters to mainstream Australian households. The integration of AI-powered features such as facial recognition, package detection, and anomaly-based alert filtering has further enhanced the value proposition by reducing false alarms and providing actionable security intelligence. Insurance companies in Australia are beginning to recognize smart security systems as risk-mitigation investments, with some offering premium discounts to policyholders with verified smart security installations, creating additional financial incentives for adoption.

Australia Smart Homes Market Segments

The Australia smart homes market is segmented across several key dimensions, reflecting the diverse range of products, technologies, sales channels, and regional demand patterns driving adoption.

Market Breakup by Product:

  • Home Monitoring and Security
  • Smart Lighting
  • Smart Speaker
  • Entertainment
  • Smart Appliance
  • HVAC Control
  • Others

Market Breakup by Software and Service:

  • Behavioural
  • Proactive

Market Breakup by Sales Channel:

  • Direct
  • Indirect

Market Breakup by Region:

  • Australia Capital Territory & New South Wales
  • Victoria & Tasmania
  • Queensland
  • Northern Territory & Southern Australia
  • Western Australia

Australia Smart Homes Market Competitive Landscape

The competitive landscape of the Australia smart homes market is dominated by global technology giants that operate the major smart home ecosystems, complemented by specialized device manufacturers, telecommunications providers, and emerging Australian smart home brands. Google (Nest), Amazon (Alexa/Echo), Apple (HomeKit), and Samsung (SmartThings) constitute the four cornerstone ecosystem platforms around which the market revolves, with Google Home and Amazon Echo devices achieving particularly high penetration—40% and 31% of Australian households respectively. These platforms compete on AI capability, device compatibility, ecosystem breadth, and increasingly, Matter protocol integration. In the security segment, Ring (Amazon), Arlo, Swann, and Eufy maintain strong Australian market positions through extensive retail distribution and competitive pricing. Smart lighting leaders Philips Hue and LIFX (Australian-founded) continue to drive category innovation. Australian telecommunications companies Telstra and Optus have entered the smart home space through bundled IoT device offerings and home security packages that leverage their existing customer bases. The competitive landscape is being reshaped by the Matter standard, which is reducing ecosystem lock-in advantages and shifting competition toward AI intelligence, user experience quality, and value-added services.

Australia Smart Homes Market Latest News & Development

  • 2026: Australia’s ‘Solar Sharer’ programme launched, requiring energy retailers to offer households with smart meters at least three hours of free solar-generated electricity during midday, driving increased adoption of smart meters and intelligent energy management systems across Australian homes.
  • Late 2025: Google began rolling out Gemini for Home to Australian Nest device owners, delivering conversational AI-powered home control that understands natural language, remembers user preferences, and provides sophisticated cross-brand device summaries using Matter 1.5 standardized data.
  • December 2025: Apple, Amazon, and Google formally embraced unified mesh networking standards with the widespread adoption of Matter 1.5 and Thread 1.4, effectively dismantling the interoperability walls between their smart home ecosystems and enabling seamless cross-platform device control for Australian consumers.
  • October 2025: Amazon launched the Echo Dot Max and Echo Show 11 featuring the new AZ3 AI chip designed specifically for local Matter 1.5 processing, along with the paid Alexa+ AI assistant that leverages unified mesh networking to control every device in the home regardless of manufacturer.
  • Mid-2025: Smart home device adoption rates in Australia crossed the 45% household penetration threshold, driven primarily by increased uptake of smart security systems and voice assistants, marking the transition of smart home technology from early-adopter category to mainstream consumer market.

Note: If you require any specific information not currently covered within the scope of the report, IMARC Group will provide it as part of customization.
Speak to an analyst:

https://www.imarcgroup.com/request?type=report&id=33105&flag=E

Australia Energy as a Service Market 2026 | Worth USD 5.1 Billion by 2034

Australia Energy as a Service Market Overview

The Australia energy as a service market size reached USD 2.3 Billion in 2025. Looking forward, IMARC Group expects the market to reach USD 5.1 Billion by 2034, exhibiting a growth rate (CAGR) of 8.60% during 2026-2034. The market is experiencing rapid expansion driven by Australia’s accelerating energy transition, with 7 GW of renewables added in 2025 and rooftop solar now installed across 4.2 million homes representing 26.8 GW of capacity. Rising energy costs, government incentives, and the proliferation of subscription-based energy models are compelling commercial and industrial users to adopt flexible, outsourced energy solutions that integrate solar generation with battery storage and smart control systems. The convergence of a AUD 2.4 billion battery storage boom, record residential battery purchases—85,000 units in H1 2025 representing 191% growth—and the Clean Energy Finance Corporation’s USD 6.6 billion investment pipeline is fundamentally reshaping how Australian businesses procure, manage, and optimize their energy consumption.

Request for a Sample Report

https://www.imarcgroup.com/australia-energy-as-a-service-market/requestsample

How AI is Reshaping the Future of the Australia Energy as a Service Market

Artificial intelligence is emerging as the foundational technology powering Australia’s energy as a service transformation, enabling providers to deliver smarter, more responsive, and cost-optimized energy solutions. AI-enabled smart grids have already demonstrated measurable impact—Queensland has cut energy wastage by 15% and improved renewable power delivery through AI-driven grid management. Advanced machine learning algorithms now predict demand patterns with unprecedented accuracy, enabling real-time balancing of distributed energy resources across vast networks. As energy grids become among the most complex systems requiring instantaneous decision-making, AI technologies are proving essential for managing the integration of solar, battery storage, and grid services that underpin modern energy as a service offerings.

  • Ausgrid is leveraging AI-powered distributed energy resource management systems for its community battery program, using machine learning algorithms to optimize charging and discharging cycles based on local solar generation patterns, grid demand signals, and individual subscriber consumption profiles—enabling its Cabarita community battery to maximize value for participating households.
  • Wärtsilä is deploying AI-integrated control systems in its DC-coupled solar-plus-storage projects across Australia, combining predictive analytics with real-time optimization algorithms that coordinate solar PV generation and battery dispatch to maximize energy yield and minimize grid export curtailment under long-term service agreements.
  • AGL Energy is implementing AI-driven virtual power plant platforms that aggregate thousands of distributed batteries and solar systems across its customer base, using machine learning to orchestrate collective charging and discharging in response to wholesale market price signals—enabling energy as a service customers to monetize their assets while supporting grid stability.
  • Energy service companies (ESCOs) are deploying AI-powered building energy management systems that use deep learning to analyze occupancy patterns, weather forecasts, and equipment performance data, automatically adjusting HVAC, lighting, and battery dispatch to deliver guaranteed energy savings under performance contracts—with AI enabling savings predictions accurate to within 3-5%.
  • The Clean Energy Finance Corporation is prioritizing AI-enabled energy infrastructure investments, supporting projects that combine smart grid technologies, predictive demand management, and automated distributed energy orchestration to accelerate the transition from traditional energy procurement to intelligent, subscription-based energy as a service models across commercial and industrial facilities.

Australia Energy as a Service Market Trends

Battery Storage Revolution and Subscription-Based Energy Models

Australia’s battery storage boom is fundamentally reshaping the energy as a service landscape, with the country emerging as the world’s third-largest utility battery market and up to 16.8 GW of grid-scale storage projected to be online by 2027—seven times current levels. The residential battery segment is experiencing explosive growth, with Australians purchasing 85,000 battery units in H1 2025 alone—a 191% increase over the same period in 2024—bringing cumulative installations to 271,000 units nationwide. This battery proliferation is enabling new subscription-based energy models where providers install solar-plus-storage systems at commercial and industrial sites under long-term service agreements, eliminating upfront capital costs while guaranteeing energy performance. Community battery initiatives, such as Ausgrid’s Cabarita activation, are pioneering shared energy storage models where residents store excess solar energy and draw from collective battery capacity on subscription terms, creating a new paradigm for distributed energy as a service delivery.

Hybrid Solar-Storage Integration and Behind-the-Meter Solutions

Hybrid solar-plus-storage projects are rapidly shifting from concept to commercial reality, with developers increasingly co-locating solar, wind, and battery assets behind single connection points to maximize renewable energy output and reduce curtailment. September 2025 marked a record milestone with 302 MW of new rooftop solar capacity added in a single month, while the national grid now includes 275 proposed generation and storage projects representing 56.6 GW combined capacity—with 23.2 GW under construction or finalizing contracts, a 43% increase year-on-year. AGL Energy’s AUD 1.2 billion investment in a 500 MW grid-scale battery at Loy Yang A exemplifies the scale of behind-the-meter solutions being developed. For commercial and industrial energy as a service customers, these integrated systems provide predictable energy costs, reduced grid dependence, and revenue opportunities through demand response participation, creating compelling financial incentives to transition from traditional utility procurement to managed energy service agreements.

Australia Energy as a Service Market Summary

  • Market Size & Forecast: The Australia energy as a service market reached USD 2.3 Billion in 2025 and is projected to grow to USD 5.1 Billion by 2034, registering a CAGR of 8.60% during the forecast period 2026-2034.
  • Battery Storage Surge: Australia is the world’s third-largest utility battery market with 14 GW/37 GWh at or nearing completion, while residential battery purchases reached 85,000 units in H1 2025 (191% growth), bringing cumulative installations to 271,000 units nationwide.
  • Renewable Capacity Expansion: Australia added 7 GW of renewables in 2025, with rooftop solar reaching 26.8 GW across 4.2 million homes (one in three Australian households), while 275 proposed generation and storage projects represent 56.6 GW of combined pipeline capacity.
  • Investment Pipeline: The Clean Energy Finance Corporation invested over AUD 6.6 billion across 30+ transactions, while AGL committed AUD 1.2 billion for a 500 MW battery at Loy Yang A and Neoen secured AUD 780 million for its 415 MW Western Downs Green Power Hub.
  • Grid-Scale Storage Trajectory: Up to 16.8 GW of grid-scale storage is projected to be online by 2027—seven times current levels—with forecasts suggesting batteries could meet up to 40% of Australia’s electricity needs by 2030, fundamentally transforming energy service delivery models.

Australia Energy as a Service Market Growth Drivers

Rising Energy Costs and Demand for Predictable Pricing Models

Persistent volatility in Australia’s wholesale electricity market is compelling commercial and industrial energy consumers to seek predictable, outsourced energy solutions that insulate them from price fluctuations. Energy as a service models address this pain point by offering fixed or performance-based pricing structures where providers assume the risk of energy cost variability while guaranteeing supply reliability and efficiency outcomes. The subscription-based approach eliminates the need for businesses to invest significant upfront capital in solar panels, batteries, and energy management systems, instead converting these capital expenditures into predictable operating expenses. Long-term Power Purchase Agreements (PPAs)—exemplified by Neoen’s 415 MW Western Downs project contracted with Queensland’s public energy retailers—provide the revenue certainty that underpins energy as a service economics, enabling providers to finance large-scale renewable generation and storage assets while delivering below-market energy rates to commercial customers.

Government Incentives and Renewable Energy Transition Mandates

Australia’s policy framework following the May 2025 federal election has established clear renewable energy transition mandates that are accelerating energy as a service adoption. The Clean Energy Finance Corporation’s AUD 6.6 billion investment across 30+ transactions—supporting clean energy technologies, land-use transformation, and major transmission infrastructure—provides critical financial support for energy service providers developing integrated solutions. Record project approvals in 2025, with 23.2 GW of generation and storage capacity under construction or finalizing contracts (43% increase year-on-year), reflect the regulatory momentum driving market expansion. Government incentives for rooftop solar, battery storage rebates, and community battery programs are lowering the entry barriers for energy as a service providers, enabling them to offer compelling commercial propositions that combine government subsidies with private capital to deliver cost-effective managed energy solutions across commercial, industrial, and community applications.

Australia Energy as a Service Market Segments

The Australia energy as a service market is segmented by service type, end user, and region, reflecting the diverse energy management requirements across commercial and industrial applications:

  • By Service Type: The market encompasses energy supply services, maintenance and operation services, and energy efficiency and optimization services. Energy supply services include solar-plus-storage installations, microgrid deployments, and PPA-based renewable generation, while maintenance and operation services cover long-term equipment monitoring and performance guarantees. Energy efficiency and optimization services leverage smart building management systems and AI-driven analytics to reduce consumption.
  • By End User: The market serves commercial and industrial segments. Commercial users—including offices, retail complexes, and hospitality venues—are adopting energy as a service to reduce operating costs and meet sustainability targets, while industrial users leverage these solutions for energy-intensive manufacturing, mining operations, and data center facilities requiring reliable, cost-optimized power supply.
  • By Region: The market spans Australia Capital Territory & New South Wales, Victoria & Tasmania, Queensland, Northern Territory & Southern Australia, and Western Australia. Queensland leads in large-scale renewable energy as a service projects, while NSW benefits from community battery initiatives and Victoria drives grid-scale storage investments.
  • Emerging Delivery Models: Subscription-based and performance-contract models are gaining rapid traction, with community battery storage enabling shared energy services for residential clusters and virtual power plants aggregating distributed assets to provide grid services—creating new revenue streams for energy as a service providers beyond traditional supply agreements.
  • Off-Grid and Microgrid Applications: Microgrid and off-grid systems account for 10-15% of energy storage demand, with remote mining sites, island communities, and Indigenous communities in the Northern Territory increasingly deploying solar-plus-battery microgrids to replace diesel generation, representing a high-growth energy as a service niche.

Australia Energy as a Service Market Competitive Landscape

The Australia energy as a service market features a competitive landscape comprising established energy utilities, global technology providers, and emerging specialist service companies. AGL Energy Limited is positioning itself as a major energy as a service player through its AUD 1.2 billion investment in a 500 MW battery at Loy Yang A and its growing virtual power plant platform that aggregates distributed energy resources. Wärtsilä is establishing differentiated positioning through integrated DC-coupled solar-plus-storage projects with long-term service agreements, combining hardware supply with ongoing operational management. Ausgrid is pioneering community-scale energy as a service through its community battery program launched at Cabarita, NSW. International partnerships are shaping the market, with Sojitz Corporation partnering with CS Energy and Nippon Koei on a Queensland renewable energy and battery storage project in January 2025. Neoen Australia is driving utility-scale energy services through its AUD 780 million Western Downs Green Power Hub under long-term PPA structures. The Clean Energy Finance Corporation serves as a critical market enabler, deploying over AUD 6.6 billion to support clean energy technologies and transmission infrastructure that underpins the energy as a service ecosystem.

Latest News & Development in the Australia Energy as a Service Market

  • April 2025: Wärtsilä announced plans to deliver one of Australia’s first DC-coupled energy storage projects, combining solar PV and battery storage with integrated control systems and a long-term service agreement, establishing a new benchmark for integrated energy as a service delivery in the Australian market.
  • March 2025: Neoen Australia announced financial close on its 415 MW Western Downs Green Power Hub in Queensland, representing AUD 780 million total investment contracted under a long-term Power Purchase Agreement with Queensland’s publicly owned energy retailers.
  • January 2025: Sojitz Corporation, in partnership with CS Energy and Nippon Koei, launched a Queensland renewable energy and battery storage project, combining Japanese investment capital with Australian energy market expertise to develop integrated generation and storage infrastructure.
  • September 2025: AGL Energy Limited confirmed a AUD 1.2 billion investment in a 500 MW grid-scale battery energy storage system co-located at its Loy Yang A site in Victoria, representing one of Australia’s largest single energy storage commitments and a cornerstone of its energy services transformation strategy.
  • August 2024: Ausgrid activated its community battery at Cabarita, New South Wales, launching an energy storage as a service offering that enables local residents to store excess solar energy and draw from shared battery capacity on a subscription basis—pioneering community-scale managed energy services.


Note: If you require any specific information not currently covered within the scope of the report, IMARC Group will provide it as part of customization.
Speak to an analyst:

https://www.imarcgroup.com/request?type=report&id=33925&flag=E

Australia Feed Additives Market 2025 | Worth USD 2.0 Billion by 2033

Australia Feed Additives Market Overview

The Australia feed additives market is experiencing robust growth, driven by the country’s expanding livestock production, rising consumer demand for high-quality protein, increasing focus on animal health and welfare, and the accelerating transition away from antibiotic growth promoters toward functional and natural alternatives. Australia’s position as one of the world’s leading producers and exporters of beef, dairy, poultry, and wool creates a substantial and growing demand base for advanced feed additive solutions that improve feed conversion efficiency, animal health outcomes, and product quality. The Australia feed additives market size reached USD 1.2 Billion in 2024. Looking forward, IMARC Group expects the market to reach USD 2.0 Billion by 2033, exhibiting a growth rate (CAGR) of 5.60% during 2025-2033. According to the Australian Bureau of Statistics, consumption of meat and poultry increased by 2.3% in 2023-2024, reinforcing the demand trajectory for feed additives that support efficient and sustainable protein production.

The market encompasses a comprehensive range of product categories including amino acids (lysine, methionine, threonine, tryptophan), phosphates, vitamins, acidifiers, carotenoids, enzymes, mycotoxin detoxifiers, flavors and sweeteners, antibiotics, minerals, antioxidants, non-protein nitrogen, preservatives, phytogenics, and probiotics. The amino acids segment accounts for the largest share by additive type, while antioxidants represent the fastest-growing segment in 2025. From a livestock perspective, the market serves ruminants (dairy cattle, beef cattle, calves), poultry (broilers, layers, breeders), swine (starters, growers, sows), aquatic animals, and other species. Poultry is the largest livestock segment driven by high production volumes and meat demand, while ruminants are the fastest-growing segment fueled by increasing animal populations, dairy demand, and the adoption of methane-reducing feed innovations. Registrations for non-antibiotic growth promoters and immune modulators have increased by 28% between 2021 and 2023, reflecting the industry’s structural shift toward functional and sustainable feed additive solutions.

Request for a sample copy of this report: https://www.imarcgroup.com/australia-feed-additives-market/requestsample

How AI is Reshaping the Future of the Australia Feed Additives Market

Artificial intelligence is fundamentally transforming animal nutrition from static, one-size-fits-all feed formulations into a predictive, data-driven discipline. AI-powered technologies are enabling Australian livestock producers to optimize feed additive usage with unprecedented precision, improving animal health outcomes, reducing feed costs, and supporting sustainability objectives across the entire livestock value chain.

  • AI-Driven Precision Feed Formulation: Machine learning algorithms are being deployed to analyze real-time data on animal growth rates, feed intake patterns, environmental conditions, and health biomarkers to dynamically adjust feed additive inclusion rates and formulations. These AI systems move beyond traditional nutrient matrices by incorporating predictive modeling that accounts for individual animal variability, seasonal factors, and production stage requirements. Companies like dsm-firmenich are bringing together digital solutions that apply advanced analytics and predictive modeling to convert complex datasets into AI-driven decision support, helping Australian producers predict risk, quantify impact, and guide proactive nutritional interventions.
  • IoT Sensor Integration and Real-Time Monitoring: AI-powered IoT sensor platforms are being deployed across Australian feedlots, dairy operations, and poultry houses to continuously monitor animal behavior, feed consumption, water intake, and environmental parameters. Computer vision systems analyze behavioral patterns to detect early signs of illness, stress, or nutritional deficiency, enabling targeted feed additive interventions before clinical symptoms manifest. These intelligent monitoring systems provide continuous, large-volume data that facilitates AI-driven precision nutrition models, allowing feed formulations to adjust in real time based on animal growth trajectories, behavior changes, and environmental conditions.
  • AI-Accelerated Bioactive Additive Discovery: Machine learning models are accelerating the discovery and development of next-generation bioactive feed additives by screening thousands of natural compound combinations for antimicrobial, immunomodulatory, and gut health properties. These AI platforms predict the efficacy of phytogenic extracts, probiotic strains, and enzyme combinations against specific gut pathogens and metabolic challenges, significantly reducing the time and cost of bringing novel functional additives to market. This capability is particularly valuable as the Australian industry transitions away from antibiotic growth promoters toward scientifically validated natural alternatives.
  • Predictive Methane Emissions Modeling: AI algorithms are being integrated with methane-reducing feed additive programs to predict and optimize emissions reduction outcomes across Australian cattle herds. These models analyze rumen microbiome data, feed composition, animal genetics, and environmental factors to forecast the methane reduction potential of specific additive protocols—such as 3-Nitrooxypropanol (3-NOP) and seaweed-based supplements—before implementation. Research shows these additives can reduce methane emissions by up to 30-80%, and AI optimization ensures maximum environmental benefit while maintaining animal productivity and economic viability.
  • AI-Optimized Supply Chain and Quality Assurance: Artificial intelligence models are being deployed across feed additive supply chains to predict demand fluctuations, optimize inventory management, and ensure consistent product quality from manufacturing through on-farm delivery. AI-powered mycotoxin detection systems analyze grain and feed ingredient samples in real time, enabling feed mills to adjust detoxifier inclusion rates dynamically based on actual contamination levels rather than conservative blanket treatments. These intelligent quality assurance systems reduce feed additive waste while ensuring consistent animal health protection across Australia’s geographically dispersed livestock operations.

Australia Feed Additives Market Trends

Transition from Antibiotics to Functional Natural Feed Additives

One of the most significant trends reshaping the Australia feed additives market is the accelerating transition from antibiotic growth promoters to functional natural alternatives, driven by the global One Health initiative, consumer demand for antibiotic-free meat products, and evolving regulatory frameworks. Registrations for non-antibiotic growth promoters and immune modulators in Australia increased by 28% between 2021 and 2023, signaling a structural shift in the industry’s approach to animal health and productivity enhancement. Probiotics, prebiotics, enzymes, phytogenic extracts, and organic acids are at the forefront of this transition, offering targeted solutions to improve immunity, optimize gut health, and maximize feed utilization in precision farming operations. In April 2025, Australia’s livestock regulatory bodies updated guidance on feed additive usage and traceability, strengthening quality assurance while enabling broader use of natural and functional additives in commercial feed, which eased compliance burdens and encouraged innovation across feed manufacturers. In August 2025, a major animal nutrition firm announced a multi-million dollar expansion of its feed additive portfolio in Australia, focusing on immune-supporting and gut-health products. This convergence of regulatory evolution, consumer expectations, and scientific validation is positioning natural and functional feed additives as the dominant growth category within the Australian market.

Methane-Reducing Feed Additive Innovation and Commercialization

A second defining trend in the Australian feed additives market is the rapid innovation and commercialization of methane-reducing feed additives, positioning Australia at the forefront of global efforts to decarbonize livestock production. Sea Forest, founded in Tasmania in 2018, develops SeaFeed—a livestock feed additive scientifically proven to reduce methane emissions by up to 80%—and is expanding production with new facilities planned across Queensland, New South Wales, Western Australia, and South Africa. Australian ag tech company Number 8 Bio secured AUD 9.6 million in funding to accelerate commercialization of its bolus-delivered product BetterFeed, while Auckland-based Ruminant Biotech received a AUD 14.8 million investment boost to launch its slow-release bolus product Emitless in the Australian market. CH4 Global Inc., identified as a key market player, is also advancing asparagopsis-based methane reduction solutions. These innovations represent a transformative market expansion opportunity, creating entirely new product categories that address both environmental sustainability goals and emerging carbon credit market opportunities for Australian livestock producers.

Australia Feed Additives Market Summary

  • Market Size (2024): USD 1.2 Billion
  • Forecast Value (2033): USD 2.0 Billion
  • Growth Rate (CAGR 2025-2033): 5.60%
  • Key Product Types: Amino Acids (largest segment), Antioxidants (fastest-growing), Enzymes, Probiotics, Phytogenics, Acidifiers, Vitamins, Minerals, Mycotoxin Detoxifiers
  • Primary Growth Drivers: Rising meat consumption (up 2.3% in 2023-24), antibiotic-to-natural additive transition (28% registration increase), methane-reducing additive innovation, precision nutrition technology adoption, and expanding livestock populations

Australia Feed Additives Market Growth Drivers

Rising Livestock Production and Protein Demand

A primary driver fueling the Australia feed additives market is the continued expansion of livestock production, underpinned by growing domestic and international demand for high-quality Australian protein. Consumption of meat and poultry increased by 2.3% in 2023-2024 according to the Australian Bureau of Statistics, while Australia’s per capita meat consumption reached approximately 94.8 kg in 2023 and beef production expanded by 3.7% year-on-year. This rising protein demand creates direct pressure on livestock producers to optimize feed conversion efficiency, maximize growth rates, and maintain animal health—all of which drive increased adoption of amino acids, enzymes, vitamins, and other performance-enhancing feed additives. Australia’s major export markets in Asia-Pacific are simultaneously growing, creating additional demand for the quality-assured, traceability-certified livestock products that premium feed additive programs enable. As both domestic consumption and export volumes expand, the requirement for advanced feed additive solutions that deliver measurable productivity improvements continues to grow proportionally.

Regulatory Support and Sustainability-Driven Innovation

Government regulatory support and sustainability-driven innovation represent another critical growth driver for the Australian feed additives market. In April 2025, Australia’s livestock regulatory bodies updated guidance on feed additive usage and traceability, strengthening quality assurance frameworks while enabling broader commercial use of natural and functional additives—easing compliance requirements and encouraging feed manufacturers to innovate. The regulatory environment is complemented by growing industry and government investment in methane-reducing feed technologies, with multiple Australian companies—including Sea Forest, Number 8 Bio, and CH4 Global—receiving significant funding to commercialize feed additives that can reduce ruminant methane emissions by up to 80%. These methane-reduction products are creating entirely new market categories and revenue streams, with potential integration into Australia’s carbon credit frameworks providing additional economic incentives for producer adoption. The alignment of regulatory modernization, sustainability imperatives, and commercial innovation is creating a supportive ecosystem for feed additive market expansion across all livestock sectors.

Australia Feed Additives Market Segments

The Australia feed additives market is segmented across source, product type, livestock, form, and region, reflecting the complexity and diversity of the country’s animal nutrition requirements:

  • Breakup by Source: The market is divided into synthetic and natural sources. Synthetic feed additives maintain a significant market presence through established amino acid, vitamin, and mineral products, while natural-source additives—including probiotics, phytogenics, and organic acids—are gaining market share as the industry transitions toward antibiotic-free production systems.
  • Breakup by Product Type: Product categories encompass amino acids (lysine, methionine, threonine, tryptophan), phosphates, vitamins, acidifiers, carotenoids, enzymes, mycotoxin detoxifiers, flavors and sweeteners, antibiotics, minerals, antioxidants, non-protein nitrogen, preservatives, phytogenics, and probiotics. Amino acids represent the largest segment, while antioxidants are the fastest-growing additive type in 2025.
  • Breakup by Livestock: The market serves ruminants (dairy cattle, beef cattle, calves), poultry (broilers, layers, breeders), swine (starters, growers, sows), aquatic animals, and others. Poultry is the largest livestock segment driven by high production volumes, while ruminants represent the fastest-growing segment fueled by expanding cattle populations, dairy demand, and methane-reducing additive adoption.
  • Breakup by Form: Feed additives are available in dry and liquid forms. Powdered (dry) formats continue to dominate the Australian market due to their flexibility, cost-effectiveness, and compatibility with a wide range of farming practices and feed mill operations, while liquid formulations are gaining traction in precision dosing applications and water-based delivery systems.
  • Breakup by Region: Regional segmentation covers Australia Capital Territory and New South Wales, Victoria and Tasmania, Queensland, Northern Territory and Southern Australia, and Western Australia. Queensland and New South Wales lead feed additive consumption driven by their large beef cattle populations and intensive poultry operations, while Victoria dominates dairy-related additive demand through its concentrated dairy farming regions.

Australia Feed Additives Market Competitive Landscape

The competitive landscape of the Australia feed additives market features a diverse mix of global animal nutrition companies, innovative Australian startups, and specialty ingredient suppliers. Key players include CH4 Global Inc., advancing asparagopsis-based methane reduction feed solutions; CirPro Australia, operating in circular protein and insect-based feed ingredient production; and NOVUS, a global methionine and specialty feed additive supplier. Australian innovators including Sea Forest (SeaFeed methane-reducing additive, up to 80% emission reduction) and Number 8 Bio (BetterFeed bolus-delivered product, AUD 9.6 million funding) are disrupting traditional market dynamics with sustainability-focused innovations. Global animal nutrition leaders such as dsm-firmenich, Cargill, Evonik, ADM, and Alltech maintain significant market presence through comprehensive product portfolios, technical service networks, and digital nutrition platforms. Competition increasingly centers on scientific validation of additive efficacy, sustainability credentials, precision nutrition capabilities, and the ability to deliver integrated digital and product solutions.

Latest News and Development in the Australia Feed Additives Market

  • January 2025: Australian livestock producers reported continued adoption of advanced feed additives, with several dairy and poultry operations citing measurable improvements in feed conversion ratios, and pilot programs integrating enzyme-based supplements showing up to 8% feed cost reduction across participating operations.
  • April 2025: Australia’s livestock regulatory bodies updated guidance on feed additive usage and traceability, strengthening quality assurance frameworks while enabling broader commercial use of natural and functional additives, easing compliance burdens and encouraging innovation across feed manufacturers nationwide.
  • August 2025: A major animal nutrition firm announced a multi-million dollar expansion of its feed additive portfolio in Australia, focusing on immune-supporting and gut-health products designed for intensive poultry and dairy operations seeking antibiotic-free production certification.
  • 2025: Sea Forest expanded its SeaFeed production operations with new facilities planned across Queensland, New South Wales, Western Australia, and South Africa, scaling its seaweed-based livestock feed additive scientifically proven to reduce methane emissions by up to 80% in ruminant livestock.
  • 2025-2026: Australian ag tech company Number 8 Bio secured AUD 9.6 million in funding to accelerate commercialization of BetterFeed, while Ruminant Biotech received a AUD 14.8 million investment boost to launch its slow-release bolus product Emitless in the Australian market, collectively advancing the country’s leadership in methane-reducing feed additive innovation.

Note: If you require any specific information not currently covered within the scope of the report, IMARC Group will provide it as part of customization.
Speak to an analyst:

Australia Fertilizer Market Size, Share, Report 2026-2034

Australia Fertilizer Market By Product Type
Australia Fertilizer Market Overview

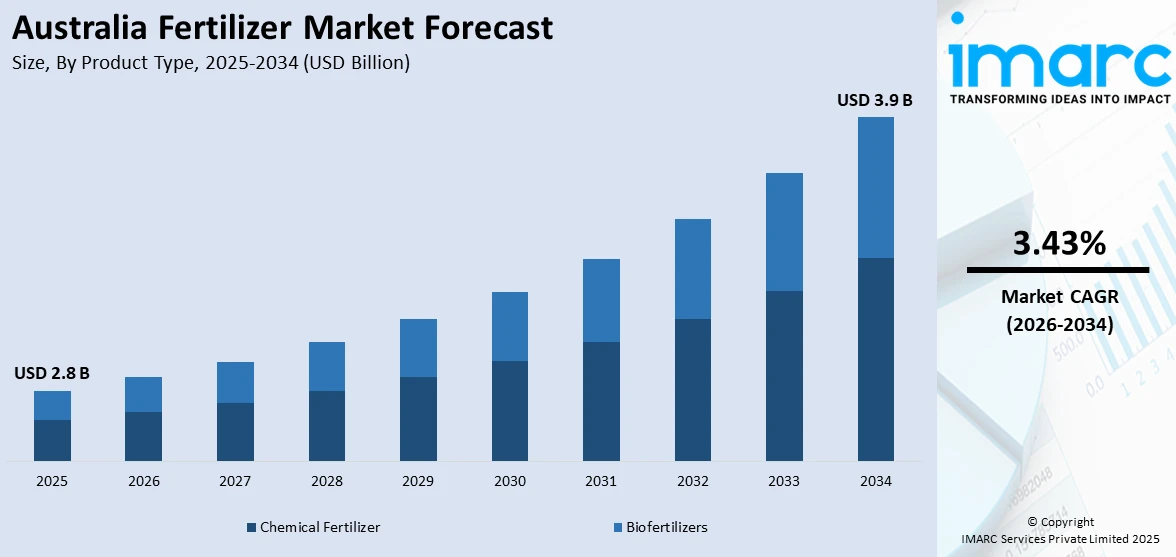
The Australia fertilizer market is experiencing steady growth, underpinned by rising agricultural productivity demands, expanding adoption of precision farming technologies, and a national push toward food security. As one of the world’s leading agricultural exporters—with farm exports reaching approximately USD 46 billion in fiscal year 2023-24—the country’s reliance on both chemical and biological fertilizers continues to deepen. The Australia fertilizer market size reached USD 2.8 Billion in 2025. Looking forward, IMARC Group expects the market to reach USD 3.9 Billion by 2034, exhibiting a growth rate (CAGR) of 3.43% during 2026-2034. Nitrogenous fertilizers, including urea, calcium ammonium nitrate, and anhydrous ammonia, remain fundamental to broad-acre cropping across wheat, canola, and barley regions, while phosphatic formulations such as MAP and DAP support root development in grain and horticultural systems.

Australia’s fertilizer consumption landscape is shaped by the country’s diverse climatic zones, soil types, and crop rotations. Western Australia and New South Wales dominate cereal production and accordingly account for a significant share of nitrogenous and phosphatic fertilizer usage, while Queensland and Victoria lead in horticultural and specialty crop applications that increasingly rely on micronutrient and liquid fertilizer formulations. The market encompasses both straight fertilizers—including nitrogenous, phosphatic, potash, secondary macronutrient, and micronutrient categories—and complex blended products tailored to specific soil-crop combinations. With straight blends holding an estimated 86.9% of the market in 2025, broad-acre efficiency continues to drive bulk fertilizer demand. Meanwhile, the biofertilizer segment is gaining traction as sustainable farming practices expand across organic and regenerative agricultural operations nationwide.

How AI is Reshaping the Future of the Australia Fertilizer Market

Artificial intelligence is fundamentally transforming how fertilizers are manufactured, distributed, and applied across Australian agriculture. From predictive analytics that optimize nutrient delivery to autonomous systems that reduce waste and environmental impact, AI-driven innovations are reshaping every link of the fertilizer value chain.

  • Precision Nutrient Management: AI-powered variable-rate application (VRA) systems, now adopted by more than half of Australian farmers, analyze real-time soil sensor data, satellite imagery, and weather forecasts to prescribe zone-specific fertilizer rates. These systems have demonstrated a projected 15% reduction in fertilizer usage while maintaining or improving crop yields, delivering significant cost savings and reducing nutrient runoff into waterways.
  • Drone-Based Aerial Monitoring and Application: AI-equipped agricultural drones using GPS, LiDAR, and computer vision technologies are enabling farmers to conduct high-resolution crop health assessments and targeted fertilizer application. These systems identify nutrient-deficient zones with centimeter-level accuracy, allowing micro-targeted delivery of liquid and granular fertilizers that minimize waste and environmental contamination across vast pastoral and cropping landscapes.
  • Predictive Soil Analytics and Digital Twin Models: Machine learning algorithms are processing decades of soil composition data alongside real-time moisture, pH, and organic matter readings to build digital twin models of Australian farmland. These predictive platforms forecast nutrient depletion cycles and recommend proactive fertilization schedules, helping growers transition from reactive to anticipatory soil management and improving long-term soil health across grain belts and horticultural regions.
  • Autonomous Fertilizer Spreading Equipment: AI-guided autonomous tractors and spreaders are being deployed across large-scale Australian farms to execute fertilizer application with consistent precision around the clock. These self-navigating machines integrate real-time data feeds from soil sensors and crop monitoring systems, adjusting application rates dynamically and operating in conditions where manual labor is impractical, addressing both labor shortages and operational efficiency challenges in remote farming regions.
  • AI-Optimized Supply Chain and Demand Forecasting: Artificial intelligence models are being deployed by fertilizer manufacturers and distributors to predict seasonal demand fluctuations, optimize inventory management, and streamline logistics networks across Australia’s vast geography. By analyzing historical purchasing patterns, weather outlooks, commodity prices, and crop planting intentions, these systems reduce stockout risks, minimize storage costs, and ensure timely fertilizer availability during critical planting windows.

Request a Business Sample Report for Procurement & Investment Evaluation: https://www.imarcgroup.com/australia-fertilizer-market/requestsample

Australia Fertilizer Market Trends

Shift Toward Domestic Fertilizer Production and Reduced Import Dependence

One of the most significant trends reshaping the Australia fertilizer market is the national movement toward domestic production capacity to reduce reliance on volatile global supply chains. Australia has historically imported the majority of its fertilizer requirements, leaving the sector exposed to international price swings and logistics disruptions. This vulnerability was starkly exposed during the global supply chain crises of 2021-2023, prompting both government and private sector action. Perdaman Industries is advancing its AUD 6 billion urea-ammonium nitrate facility in Karratha, Western Australia, which will produce approximately 2.3 million tons annually when commissioned between 2025-2027. Simultaneously, Woodside Energy’s Beaumont New Ammonia project is expected to add 1.1 million tons of capacity, with first production targeted for 2026. These landmark investments represent a structural shift in Australia’s fertilizer supply architecture, moving from import-dependent procurement to vertically integrated domestic manufacturing. The Australian government has further supported this transition through AUD 814 million in subsidies for green ammonia production, incentivizing low-emissions nitrogen manufacturing that aligns with the country’s broader climate and agricultural sustainability objectives.

Growing Adoption of Biofertilizers and Sustainable Nutrient Solutions

A second defining trend in the Australian fertilizer landscape is the accelerating adoption of biofertilizers and sustainable nutrient management solutions, driven by increasing environmental awareness, tightening regulatory requirements, and growing consumer demand for sustainably produced food. Australian regulatory authorities are imposing stricter limits on heavy metals in fertilizer products, with cadmium content limits tightening to not exceed 300 mg/kg from 2026, which is constraining supply options for conventional imports and encouraging the development of cleaner alternatives. Biofertilizers—including nitrogen-fixing bacteria, phosphate-solubilizing microorganisms, and mycorrhizal fungi formulations—are gaining market share among organic producers and progressive conventional farmers seeking to reduce chemical input costs while improving long-term soil biology and structure. The federal government’s 2035 agricultural emissions-reduction plan has further accelerated adoption of low-emissions nitrogen products, with enhanced efficiency fertilizers (EEFs) featuring nitrification and urease inhibitors becoming standard recommendations from agricultural advisors across grain-growing regions. This convergence of regulatory pressure, sustainability commitments, and agronomic benefits is positioning biofertilizers and enhanced-efficiency products as a structurally growing segment within Australia’s fertilizer market.

Australia Fertilizer Market Summary

  • Market Size (2025): USD 2.8 Billion
  • Forecast Value (2034): USD 3.9 Billion
  • Growth Rate (CAGR 2026-2034): 3.43%
  • Key Product Types: Chemical Fertilizers, Biofertilizers
  • Primary Growth Drivers: Expanding domestic production capacity, precision agriculture adoption, government green ammonia subsidies, rising agricultural export volumes, and tightening environmental regulations

Australia Fertilizer Market Growth Drivers

Expanding Agricultural Output and Export-Oriented Production Intensification

A primary driver fueling the Australia fertilizer market is the continued expansion of agricultural output, particularly in export-oriented commodity crops. Australia’s agricultural sector generated approximately USD 46 billion in exports during fiscal year 2023-24, with wheat, canola, barley, and horticultural products forming the backbone of this output. To sustain high yields and maintain soil fertility across successive growing seasons, farmers are intensifying fertilizer application—particularly nitrogenous and phosphatic products—across the major grain-growing regions of Western Australia, New South Wales, and Victoria. The growing global demand for Australian agricultural commodities, coupled with government trade agreements expanding market access in Asia-Pacific, is creating sustained upward pressure on fertilizer consumption. As broad-acre farming operations scale to meet international demand, the requirement for both bulk straight fertilizers and precision-formulated complex blends continues to rise, directly supporting the market’s growth trajectory through 2034.

Government Incentives for Green Ammonia and Low-Emissions Fertilizer Manufacturing

Government policy support represents another critical growth driver for the Australian fertilizer market. The federal government has committed AUD 814 million (approximately USD 578 million) in subsidies to support domestic green ammonia production, directly reducing manufacturing costs for low-emissions nitrogen fertilizers and strengthening the economic viability of local production against cheaper imports. This policy framework aligns with Australia’s 2035 agricultural emissions-reduction plan, which targets meaningful reductions in greenhouse gas output from fertilizer use across the farming sector. Beyond direct subsidies, state governments in Western Australia, Queensland, and South Australia are offering infrastructure incentives and streamlined approvals for fertilizer manufacturing and storage facilities. Agfert Fertilizers, for instance, completed a new 20,000-ton fertilizer storage and distribution facility on the Eyre Peninsula in early 2025, featuring approximately 10,000 square meters of covered storage. These combined federal and state policy mechanisms are creating a supportive ecosystem for domestic fertilizer production investment, driving both supply-side capacity expansion and demand-side adoption of next-generation sustainable fertilizer products.

Australia Fertilizer Market Segments

The Australia fertilizer market is segmented across multiple dimensions, reflecting the diverse needs of the country’s agricultural sector:

  • Breakup by Product Type: The market is categorized into chemical fertilizers and biofertilizers. Chemical fertilizers continue to dominate owing to their broad-acre efficiency and established supply chains, while biofertilizers are gaining traction among organic producers and environmentally conscious farming operations seeking sustainable soil management solutions.
  • Breakup by Straight Fertilizer Category: Straight fertilizers are divided into nitrogenous (urea, calcium ammonium nitrate, ammonium nitrate, ammonium sulfate, anhydrous ammonia), phosphatic (MAP, DAP, SSP, TSP), potash (MoP, SoP), secondary macronutrients (calcium, magnesium, sulfur), and micronutrients (zinc, manganese, copper, iron, boron, molybdenum). Straight blends accounted for approximately 86.9% of the market in 2025, with nitrogenous products leading demand across cereal and oilseed cropping systems.
  • Breakup by Product Form: The market is segmented into dry and liquid forms. Dry fertilizers remain the predominant format for bulk broad-acre application, while liquid formulations are experiencing growing adoption driven by precision agriculture technologies that enable more efficient variable-rate application across diverse soil and crop conditions.
  • Breakup by Crop Type: The market segments by crop type include grains and cereals, pulses and oilseeds, fruits and vegetables, flowers and ornamentals, and others. Grains and cereals—particularly wheat, barley, and canola—constitute the largest consumption segment, reflecting Australia’s position as a major global exporter of these staple commodities.
  • Breakup by Region: Regional segmentation includes Australia Capital Territory and New South Wales, Victoria and Tasmania, Queensland, Northern Territory and Southern Australia, and Western Australia. Western Australia and New South Wales are the leading fertilizer-consuming regions, driven by their extensive grain and oilseed production, while Queensland contributes significant demand from sugarcane and horticultural applications.

Australia Fertilizer Market Competitive Landscape

The competitive landscape of the Australia fertilizer market features a mix of established domestic manufacturers, global chemical conglomerates, and emerging specialty fertilizer companies. Key players include Incitec Pivot Fertilisers (IPF), one of Australia’s largest domestic producers with extensive manufacturing and distribution infrastructure, and Agfert Fertilizers, which has been expanding its storage and distribution capacity with new facilities on the Eyre Peninsula. The market also includes major international participants such as Nutrien, Yara International, CSBP (Wesfarmers), and Impact Fertilisers, which compete across product lines ranging from bulk commodity fertilizers to precision specialty formulations. Emerging entrants in the biofertilizer and green ammonia space are intensifying competition, with Perdaman Industries’ Karratha mega-facility poised to reshape the domestic manufacturing landscape. These players are investing in advanced manufacturing technologies, expanding logistics networks, and developing sustainable product portfolios to capture market share in an increasingly quality-conscious and environmentally regulated market environment.

Latest News and Development in the Australia Fertilizer Market

  • January 2025: Agfert Fertilizers completed its new 20,000-ton fertilizer storage and distribution facility on the Eyre Peninsula in South Australia, featuring approximately 10,000 square meters of covered storage structured across three major stockpiles and eight smaller storage sections, enhancing supply chain resilience for regional farmers.
  • 2025: Perdaman Industries continued advancing construction on its AUD 6 billion urea-ammonium nitrate manufacturing facility in Karratha, Western Australia, which will produce approximately 2.3 million tons annually and represent the largest single fertilizer production investment in Australian history.
  • 2025: The Australian government announced that cadmium content limits in imported fertilizers would tighten to not exceed 300 mg/kg from 2026, marking a significant regulatory shift that is expected to reshape import supply chains and accelerate domestic production of compliant fertilizer products.
  • 2025-2026: The Australian dollar depreciated to its lowest level against the US dollar in 22 years, significantly increasing the landed cost of imported fertilizers priced in USD and strengthening the business case for domestic manufacturing and alternative sourcing strategies across the fertilizer supply chain.
  • 2026: Woodside Energy’s Beaumont New Ammonia project is targeting first production in 2026, adding approximately 1.1 million tons of ammonia capacity to Australia’s domestic fertilizer feedstock supply and supporting the country’s green hydrogen and low-emissions fertilizer manufacturing ambitions.

Note: If you require any specific information not currently covered within the scope of the report, IMARC Group will provide it as part of customization.

Speak to an analyst:

https://www.imarcgroup.com/request?type=report&id=21966&flag=E

Australia Construction Equipment Market 2025 | Worth USD 2.4 Billion by 2033

Australia Construction Equipment Market Overview

The Australia construction equipment market is experiencing steady growth, propelled by massive government infrastructure investment programs, booming mining sector activity, accelerating urban development across Sydney, Melbourne, and Brisbane, and the technological transformation of equipment fleets through electrification, automation, and telematics integration. Australia’s position as one of the world’s largest mining nations—producing iron ore, coal, gold, lithium, and critical minerals—creates substantial demand for heavy construction and earthmoving equipment, while the national infrastructure pipeline drives sustained investment in cranes, loaders, excavators, and material handling machinery. The Australia construction equipment market size reached USD 1.9 Billion in 2024. Looking forward, IMARC Group expects the market to reach USD 2.4 Billion by 2033, exhibiting a growth rate (CAGR) of 2.50% during 2025-2033. In April 2025, Epiroc secured an AUD 350 million (USD 230.5 million) contract with Fortescue for autonomous mining equipment, demonstrating the scale of investment in next-generation construction and mining machinery across the Australian market.

The market encompasses products and services across heavy and compact construction equipment categories, including loaders, cranes, forklifts, excavators, dozers, and other specialized machinery serving excavation and mining, lifting and material handling, earth moving, and transportation applications. Earthmoving equipment accounts for the largest market share, with excavators being the dominant equipment type driven by investment in public infrastructure and intensive utilization in the mining sector. The market reached approximately 24,422 units in 2024 and is projected to reach 27,180 units by 2030. Construction hotspots in 2025 include Sydney (Metro project), Melbourne (West Gate Tunnel), and Brisbane (2032 Olympics preparation), while mining operations across Western Australia, Queensland, and the Northern Territory continue to drive heavy equipment demand. Euro VI Stage C emission rules effective November 2024 are incentivizing battery-electric cranes, loaders, and mini-excavators on metropolitan jobsites, as cities restrict diesel idling near hospitals and schools. Caterpillar’s autonomous mining fleet has safely moved over 11 billion tonnes of material and traveled more than 380 million kilometers, establishing Australia as a global leader in autonomous heavy equipment deployment.

How AI is Reshaping the Future of the Australia Construction Equipment Market

Artificial intelligence is fundamentally transforming the Australian construction equipment sector, leveraging the country’s world-leading experience in autonomous mining to pioneer intelligent machinery across all construction applications. AI-powered technologies are enhancing equipment productivity, safety, fleet utilization, and operational efficiency while enabling the transition toward fully autonomous jobsites.

  • Autonomous Equipment Operation and Machine Guidance: AI-powered autonomous systems are transforming construction equipment from human-operated machines into self-directing intelligent platforms. Australia leads globally in autonomous haul truck deployment, with Caterpillar’s autonomous mining fleet having safely moved over 11 billion tonnes and traveled 380 million kilometers without a single lost-time injury. Epiroc’s AUD 350 million contract with Fortescue for autonomous mining equipment demonstrates the commercial maturity and investment confidence in AI-driven autonomy. The technology is now expanding from mining into urban construction, with autonomous excavators, bulldozers, and compactors being trialed on infrastructure projects. The National Transport Commission’s Automated Vehicle Safety Law, set to roll out in 2026, will establish the regulatory framework for autonomous heavy equipment operation on public and private construction sites across Australia.
  • AI-Driven Predictive Maintenance and Equipment Lifecycle Management: Machine learning platforms are transforming construction equipment maintenance from reactive and time-based approaches into predictive, condition-based strategies that minimize downtime and extend asset life. AI algorithms analyze real-time sensor data—including oil analysis, vibration patterns, hydraulic pressures, engine temperatures, and component wear indicators—to predict failures before they occur and automatically schedule maintenance interventions. In 2026, the trend is advancing toward fully autonomous maintenance actions where AI systems automatically order replacement parts, schedule technicians, and notify project managers of planned downtime windows without human intervention. For large fleet operators managing hundreds of machines across Australian mining and construction sites, AI-driven predictive maintenance reduces unplanned downtime by up to 30% and extends component life by optimizing operating parameters.
  • Telematics and Intelligent Fleet Management: AI-powered telematics platforms are providing construction equipment operators with comprehensive real-time visibility across geographically dispersed fleets, enabling data-driven decisions on equipment utilization, fuel efficiency, and operational productivity. Market penetration for commercial vehicle telematics in Australia has reached approximately 75%, with the installed base projected to double by 2028. These intelligent fleet management systems use machine learning to optimize equipment allocation across multiple project sites, identify underutilized assets, predict fuel consumption, and generate automated compliance reports. GPS-enabled machinery combined with AI-powered site mapping tools enable centimeter-level positioning accuracy for grading, excavation, and piling operations, reducing rework and material waste while improving construction quality and speed.
  • Computer Vision for Safety and Productivity Monitoring: AI-powered computer vision systems are being deployed on construction equipment and jobsites to monitor safety compliance, detect potential collision risks, and analyze operator productivity in real time. Camera-based systems combined with deep learning algorithms identify workers, vehicles, and obstacles within equipment blind spots, providing automated alerts and emergency stop capabilities that prevent struck-by incidents—the leading cause of construction fatalities. These same computer vision platforms analyze equipment operation patterns to identify productivity bottlenecks, cycle time inefficiencies, and operator behaviors that impact performance, providing data-driven coaching recommendations that improve fleet-wide productivity without capital investment in new equipment.
  • AI-Optimized Electric Equipment Integration and Energy Management: Machine learning algorithms are optimizing the deployment and operation of battery-electric construction equipment, which is expanding at a 4.81% CAGR as Euro VI Stage C emission rules incentivize zero-emission machinery on metropolitan jobsites. AI systems manage battery charging schedules, optimize energy consumption during operation, and predict range requirements based on planned work activities, enabling effective fleet electrification without compromising productivity. These intelligent energy management systems are critical for the successful integration of electric equipment like XCMG’s XC968-EV electric loader and Volvo CE’s hybrid excavators into mixed fleets, ensuring electric machines are deployed to tasks where their operating characteristics deliver maximum value.

Request for a sample copy of this report: https://www.imarcgroup.com/australia-construction-equipment-market/requestsample

Australia Construction Equipment Market Trends

Equipment Electrification and Zero-Emission Machinery Adoption

One of the most significant trends reshaping the Australia construction equipment market is the accelerating transition toward battery-electric and hybrid machinery, driven by tightening emission regulations, corporate sustainability commitments, and improving electric equipment performance that is achieving parity with diesel equivalents. Battery-electric construction equipment units are projected to expand at a 4.81% CAGR during 2025-2030, as Euro VI Stage C emission rules effective November 2024 incentivize zero-emission cranes, loaders, and mini-excavators on metropolitan construction sites. At the 2025 National Diesel Dirt and Turf Expo, XCMG showcased its upgraded XC968-EV electric loader, XE215LC hybrid excavator, and XE19UE mini excavator, demonstrating the broadening range of electrified equipment available to Australian contractors. Toyota Material Handling Australia unveiled 22 new electric-powered products at CeMAT Australia 2025, including electric pneumatic counterbalance models with advanced safety features. Volvo Construction Equipment launched six new excavator models in Australia in July 2025—the EC210, EC220, EC230, EC260, EC300, and EC360—featuring engine-pump optimization technology delivering up to 15% greater fuel efficiency compared to previous models. Liebherr secured multiple orders for electric excavators slated for delivery in 2024 and 2025 from major miners pursuing decarbonization targets. Cities are increasingly restricting diesel idling near hospitals and schools, creating urban construction zones where electric equipment provides both regulatory compliance and competitive advantage.

Autonomous and Semi-Autonomous Equipment Deployment

A second defining trend in the Australian construction equipment market is the expanding deployment of autonomous and semi-autonomous machinery from mining operations into mainstream construction applications, leveraging Australia’s global leadership in autonomous heavy equipment technology. Australia pioneered autonomous haul truck deployment in mining, with Caterpillar’s autonomous fleet having safely moved over 11 billion tonnes of material across more than 380 million kilometers without a single lost-time injury—establishing the operational confidence and regulatory frameworks now being extended to construction applications. In April 2025, Epiroc secured an AUD 350 million contract with Fortescue for autonomous mining equipment, demonstrating continued investment acceleration in AI-driven machinery. The technology is transitioning from controlled mining environments to more complex urban construction sites, with autonomous excavation, grading, and compaction systems being developed and trialed. The National Transport Commission’s Automated Vehicle Safety Law, scheduled for rollout in 2026, will establish the legal framework for autonomous heavy equipment operation, removing a key barrier to broader adoption. Komatsu launched the PC88MR-11 midi excavator with advanced machine control systems in 2025, while telematics penetration across commercial vehicle fleets reached approximately 75%, creating the digital infrastructure foundation upon which autonomous construction operations will be built.

Australia Construction Equipment Market Summary

  • Market Size (2024): USD 1.9 Billion
  • Forecast Value (2033): USD 2.4 Billion
  • Growth Rate (CAGR 2025-2033): 2.50%
  • Key Segments: Earthmoving Equipment (largest, led by excavators), Heavy Construction Equipment (dominant category), Construction and Infrastructure (largest industry), Electric Equipment (fastest-growing at 4.81% CAGR 2025-2030)
  • Primary Growth Drivers: National infrastructure programs (Sydney Metro, West Gate Tunnel, Brisbane 2032 Olympics), strong mining sector demand, Epiroc AUD 350M Fortescue autonomous contract, Euro VI Stage C emission rules driving electrification, and 75% telematics fleet penetration enabling digital transformation

Australia Construction Equipment Market Growth Drivers

Massive Infrastructure Investment and Olympic Preparation

A primary driver propelling the Australia construction equipment market is the unprecedented pipeline of public infrastructure investment spanning transport, energy, social, and Olympic preparation projects that create sustained multi-year demand for construction machinery across all equipment categories. The Australian government’s National Infrastructure Program continues to fund major transport projects including Sydney Metro (one of Australia’s largest public transport projects), the West Gate Tunnel in Melbourne, and extensive road, rail, and port upgrades across state jurisdictions. Brisbane’s selection as host city for the 2032 Olympic and Paralympic Games has triggered an unprecedented construction boom encompassing new sporting venues, athlete villages, transport infrastructure, and urban regeneration projects that will sustain elevated equipment demand through the next decade. Rapid urbanization across Sydney, Melbourne, and Brisbane—combined with housing supply shortfalls requiring accelerated residential construction—creates additional demand for compact and mid-range equipment including mini-excavators, skid-steer loaders, and compact cranes suited to space-constrained urban sites. This multi-layered infrastructure investment pipeline provides equipment manufacturers, dealers, and rental companies with long-term demand visibility that supports capital investment in fleet expansion and technology upgrades.

Mining Sector Expansion and Critical Minerals Development

Another critical growth driver for the Australian construction equipment market is the expanding mining sector, which drives substantial demand for heavy earthmoving equipment, autonomous haul trucks, and specialized extraction machinery across iron ore, coal, gold, lithium, and critical mineral operations. Australia is the world’s largest exporter of iron ore and lithium, with mining operations spanning Western Australia’s Pilbara region, Queensland’s Bowen Basin, and emerging critical minerals projects across multiple states. The global energy transition is creating new demand for Australian lithium, cobalt, nickel, and rare earth minerals essential for battery production, driving mine development and expansion that requires significant equipment investment. In April 2025, Epiroc secured an AUD 350 million contract with Fortescue for autonomous mining equipment, demonstrating the scale and technology intensity of Australian mining equipment procurement. Mining operations are pioneering the adoption of autonomous haul trucks, electric excavators, and AI-powered fleet management systems that are subsequently being adapted for broader construction applications. Liebherr has secured multiple orders for electric excavators from major Australian miners pursuing decarbonization targets, reflecting the mining industry’s role as an early adopter of zero-emission heavy equipment that creates market scale and cost reductions benefiting the broader construction sector.

Australia Construction Equipment Market Segments

The Australia construction equipment market is segmented by solution type, equipment size, type, application, industry, and region, reflecting the breadth of machinery requirements across construction and mining operations:

  • Breakup by Solution Type: The market is divided into products (equipment sales) and services (rental, maintenance, aftermarket parts). The services segment is experiencing strong growth driven by the increasing preference of contractors for rental and leasing arrangements that provide fleet flexibility without large capital outlays, particularly for specialized or infrequently used equipment.
  • Breakup by Equipment Type: Categories include heavy construction equipment and compact construction equipment. Heavy equipment dominates driven by mining and major infrastructure projects, while compact equipment is the fastest-growing segment supported by urban construction in space-constrained sites and residential building activity.
  • Breakup by Type: Equipment types include loaders, cranes, forklifts, excavators, dozers, and others. Excavators represent the largest segment, accounting for the dominant share of earthmoving equipment demand driven by infrastructure development and mining operations. Komatsu launched the PC88MR-11 midi excavator for tight-access applications in 2025, while Volvo CE introduced six new excavator models featuring 15% improved fuel efficiency.
  • Breakup by Industry: Industries served include oil and gas, construction and infrastructure, manufacturing, mining, and others. Construction and infrastructure represents the largest industry segment driven by the national infrastructure pipeline, while mining is a critical demand driver particularly in Western Australia and Queensland.
  • Breakup by Region: Regional segmentation covers Australia Capital Territory and New South Wales, Victoria and Tasmania, Queensland, Northern Territory and Southern Australia, and Western Australia. Western Australia and Queensland lead mining equipment demand, while New South Wales and Victoria dominate construction and infrastructure equipment requirements through major urban projects.

Australia Construction Equipment Market Competitive Landscape

The competitive landscape of the Australia construction equipment market is dominated by global OEMs with established dealer networks, complemented by emerging Chinese manufacturers and specialized local equipment providers. Caterpillar maintains market leadership through its comprehensive product range, autonomous mining fleet technology (11 billion tonnes moved), and extensive WesTrac and Hastings Deering dealer networks. Komatsu competes strongly across mining and construction segments, launching the PC88MR-11 midi excavator in 2025. Volvo CE launched six new excavator models in July 2025 featuring 15% improved fuel efficiency and hybrid technology. Hitachi Construction Machinery and Liebherr serve premium heavy equipment segments, with Liebherr securing electric excavator orders from major miners. XCMG is expanding rapidly in Australia with electric and hybrid equipment including the XC968-EV loader. LiuGong Australia and Takeuchi serve compact equipment segments, while Epiroc leads in autonomous mining equipment with its AUD 350 million Fortescue contract. Competition increasingly centres on autonomous capabilities, electric/hybrid powertrains, telematics integration, total cost of ownership, and aftermarket service quality.

Latest News and Development in the Australia Construction Equipment Market

  • April 2025: Epiroc secured an AUD 350 million (USD 230.5 million) contract with Fortescue for autonomous mining equipment, representing one of the largest single autonomous equipment procurement deals in Australian mining history and demonstrating accelerating investment in AI-driven machinery.
  • July 2025: Volvo Construction Equipment launched six new excavator models in Australia—the EC210, EC220, EC230, EC260, EC300, and EC360—featuring engine-pump optimization technology delivering up to 15% greater fuel efficiency compared to previous generation models.
  • 2025: XCMG showcased the upgraded XC968-EV electric loader, XE215LC hybrid excavator, and XE19UE mini excavator at the National Diesel Dirt and Turf Expo, while Toyota Material Handling Australia unveiled 22 new electric-powered products at CeMAT Australia 2025, signaling the industry’s accelerating electrification transition.
  • 2025: Komatsu launched the PC88MR-11 midi excavator in Australia for tight-access excavation, rock work, and utilities projects, expanding the compact equipment range available for urban construction applications where space constraints limit the use of full-size machinery.
  • 2026: The National Transport Commission’s Automated Vehicle Safety Law is set for rollout, establishing the legal framework for autonomous heavy construction equipment operation and removing a key regulatory barrier to broader deployment of AI-driven machinery on Australian construction and mining sites.

Note: If you require any specific information not currently covered within the scope of the report, IMARC Group will provide it as part of customization.
Speak to an analyst:

https://www.imarcgroup.com/request?type=report&id=24741&flag=E

Australia Online Grocery Market 2026 | Worth USD 96,585 Million by 2034

Australia Online Grocery Market Overview

The Australia online grocery market is experiencing explosive growth, driven by massive fulfilment centre automation investments by major retailers, surging smartphone-based shopping adoption, expanding delivery speed and coverage, the integration of AI-powered personalisation and demand forecasting, and the permanent shift in consumer purchasing behaviour catalysed by the pandemic era. The Australia online grocery market size stood at USD 17,216 Million in 2025, reflecting the accelerating digital transformation of Australia’s grocery retail landscape. App-based platforms dominate with 62.4% of the market, driven by Australia’s smartphone penetration exceeding 95% of the population and 25.94 million internet users representing 96.7% of the population as of February 2026. Hybrid marketplace models command 47.2% of the market, led by Woolworths and Coles which anchor Australia’s omnichannel grocery ecosystems. Woolworths’ online food sales exceeded AUD 9.1 billion in FY2025, with its Everyday Rewards program boasting 10.2 million active members as of February 2025 — representing more than half of Australia’s adult population. Coles’ online sales surged 25.7% over the twelve months to March 2025, with Q1 FY26 online sales increasing 27.9% and penetration reaching 13.3%, while Woolworths’ online penetration reached 16.2%. Click-and-collect remains uniquely popular in Australia, accounting for approximately 40% of online sales at the top two retailers, reflecting consumer preference for flexibility and convenience. Australian food and beverages online spending reached AUD 13.6 billion in 2024, within a total online purchase market of AUD 69 billion.

Looking forward, the Australia online grocery market is projected to hit USD 96,585 Million by 2034, advancing at a CAGR of 20.37% through 2026-2034. This extraordinary growth trajectory is being supported by unprecedented infrastructure investment in automated customer fulfilment centres, the aggressive expansion of Amazon Fresh into the Australian market, the development of express delivery capabilities targeting sub-60-minute windows, and the deepening integration of AI across the entire online grocery value chain from demand prediction to last-mile delivery optimisation. Coles and Woolworths invested a combined AUD 200 million in automation between 2024 and 2025, enabling chilled-chain reliability within 2 hours. Coles commissioned its Witron-powered automated facility in Truganina, Victoria, in October 2024, unlocking capacity for tens of thousands of automated daily order picks, and launched a Perth express delivery pilot in February 2025 targeting 60-minute delivery. Woolworths’ Moorebank Customer Fulfilment Centre targets 60,000+ online orders per week, while the company opened a AUD 60 million fulfilment hub in Adelaide and announced the Heathwood CFC in Brisbane in May 2025 using Witron automation technology. Amazon Fresh extended to 47 additional Sydney suburbs in December 2024 and 80 more in January 2026, while Amazon announced a AUD 750 million Brisbane facility in March 2026 creating 1,000+ permanent jobs. In December 2025, Coles partnered with Uber Eats to expand 50%+ of Coles items for on-demand delivery. Amazon partnered with Harris Farm Markets to offer fresh local products through Amazon, with Harris Farm fulfilling orders from stores and Amazon Flex delivery partners handling last-mile delivery.

Request a Business Sample Report for Procurement & Investment Evaluation:

https://www.imarcgroup.com/australia-online-grocery-market/requestsample

How AI is Reshaping the Future of the Australia Online Grocery Market

Artificial intelligence is fundamentally transforming Australia’s online grocery market, revolutionising demand forecasting, fulfilment automation, personalised shopping experiences, delivery route optimisation, and quality assurance. With the Australian AI in retail market generating USD 310.9 million in 2024 and projected to reach USD 1,990.6 million by 2030, and over 45% of retail SMEs already implementing AI solutions, the sector is undergoing rapid intelligent transformation. Key developments include:

  • AI-Powered Demand Forecasting and Inventory Optimisation: Machine learning algorithms are transforming inventory management for online grocery operations by analysing historical purchase patterns, seasonal trends, weather data, promotional calendars, local events, and real-time demand signals to predict product demand with unprecedented accuracy at the store and fulfilment centre level. These AI systems enable Woolworths and Coles to optimise stock allocation across their customer fulfilment centres, reducing out-of-stock rates for online orders, minimising fresh food waste, and ensuring that the right products are available in the right quantities at the right fulfilment locations. The integration of AI-driven demand prediction with Witron automated picking systems at Coles’ Truganina facility and Woolworths’ expanding CFC network creates a powerful feedback loop where demand intelligence directly drives automated fulfilment efficiency.
  • AI-Enabled Produce Quality Grading and Automated Fulfilment: Woolworths implemented an AI-enabled produce grading system at its Sydney fulfilment facility in March 2025, using computer vision and machine learning to automatically assess the quality, ripeness, and condition of fresh produce for home delivery orders. This technology ensures that online grocery customers receive produce that meets or exceeds the quality they would select in-store, addressing one of the primary barriers to online fresh food adoption. The system analyses visual characteristics including colour, shape, size, and surface condition to grade produce in real time as it moves through the automated fulfilment process, rejecting items that don’t meet quality thresholds and ensuring consistent customer satisfaction across thousands of daily orders.
  • Hyper-Personalised Shopping Experiences and Recommendation Engines: AI-powered recommendation engines are transforming the online grocery shopping experience by analysing individual purchase history, dietary preferences, household composition, browsing behaviour, and seasonal patterns to deliver hyper-personalised product suggestions, meal planning assistance, and automated shopping list generation. Woolworths’ Everyday Rewards program — with 10.2 million active members — provides a vast dataset that AI systems leverage to personalise offers, predict repurchase timing, and recommend complementary products that increase basket size and customer satisfaction. These personalisation capabilities are particularly powerful in the subscription segment, where AI can predict when households need to replenish staple items and proactively suggest reorders at optimal intervals.
  • AI-Optimised Last-Mile Delivery and Route Planning: Machine learning algorithms are optimising last-mile delivery operations — the most expensive component of online grocery fulfilment — by dynamically routing delivery vehicles based on real-time traffic conditions, delivery window preferences, vehicle capacity, temperature-sensitive product requirements, and geographic clustering of orders. Coles’ February 2025 Perth express delivery pilot targeting 60-minute delivery windows relies on AI-powered route optimisation to achieve rapid fulfilment within economically viable operating parameters. These systems continuously learn from delivery performance data to improve routing accuracy, reduce delivery times, and lower per-order delivery costs.
  • AI-Driven Dynamic Pricing and Promotional Intelligence: AI-powered pricing engines are enabling Australian online grocery retailers to implement dynamic pricing strategies that optimise margins while maintaining competitive positioning across thousands of product lines. These systems analyse competitor pricing, demand elasticity, inventory levels, product shelf life, and promotional effectiveness to adjust prices in real time, maximising revenue while minimising waste on perishable items. AI-driven promotional intelligence tools identify the most effective promotional mechanics, optimal discount levels, and ideal timing for each customer segment, improving the return on promotional investment and driving incremental online order volume.

Australia Online Grocery Market Trends

Massive Automated Fulfilment Centre Investment Transforming Online Grocery Infrastructure

The unprecedented investment in automated customer fulfilment centres by Australia’s leading grocery retailers represents the most transformative infrastructure trend in the online grocery market, as Woolworths, Coles, and Amazon build the high-capacity, technology-enabled distribution networks required to serve rapidly growing online demand with improved speed, accuracy, and cost efficiency. Coles and Woolworths invested a combined AUD 200 million in automation between 2024 and 2025, enabling chilled-chain reliability within 2-hour delivery windows that match the temperature integrity requirements of fresh, chilled, and frozen grocery products. Coles commissioned its Witron-powered automated facility in Truganina, Victoria, in October 2024, unlocking capacity for tens of thousands of automated daily order picks at substantially reduced operational cost compared to manual store-based fulfilment. Woolworths’ Moorebank Customer Fulfilment Centre targets 60,000+ online orders per week, while the company opened a AUD 60 million fulfilment hub in Adelaide — joining its network of seven CFCs across all major eastern cities — and announced the Heathwood CFC in Brisbane in May 2025, also using Witron automation technology. Amazon’s announcement of a AUD 750 million Brisbane facility in March 2026 — spanning 150,000 square metres and creating 1,000+ permanent jobs — signals the intensifying infrastructure arms race between established Australian retailers and global competitors. This automated fulfilment investment is critical to achieving the unit economics necessary to sustain rapid online grocery growth, as automated picking systems deliver 3-5x the throughput of manual store-based fulfilment at lower error rates, enabling retailers to process the increasing order volumes projected in the market’s 20.37% CAGR growth trajectory.

Express Delivery, Quick Commerce, and On-Demand Grocery Partnerships Accelerating Consumer Adoption

The rapid development of express delivery capabilities, quick commerce models, and strategic partnerships between traditional grocery retailers and on-demand delivery platforms is fundamentally reshaping consumer expectations and accelerating adoption of online grocery shopping across Australia. Coles launched a Perth express delivery pilot in February 2025 targeting 60-minute delivery windows, demonstrating the shift from next-day and same-day delivery models toward sub-hour fulfilment that positions online grocery as a real-time shopping alternative rather than a planned-ahead convenience. In December 2025, Coles partnered with Uber Eats to expand availability of 50%+ of Coles items through on-demand delivery, creating a powerful distribution channel that leverages Uber’s existing delivery infrastructure and consumer app ecosystem. Amazon Fresh extended to 47 additional Sydney suburbs in December 2024 and 80 more in January 2026, progressively building the geographic coverage necessary to challenge incumbent retailers’ last-mile advantage, while Amazon’s partnership with Harris Farm Markets enables fresh local product delivery through Amazon’s platform with Harris Farm fulfilling orders from stores. One-time purchases represent 65.7% of the market, indicating significant growth potential for subscription models as express delivery capabilities reduce the need for advance planning and enable impulse and top-up online grocery shopping. Staples and cooking essentials represent 25.8% of the market by product type, with Coles pantry essentials showing the highest repeat transaction frequency — a pattern that supports the development of automated replenishment and subscription services. The convergence of rapid delivery, extensive product availability, competitive pricing, and seamless digital experiences is progressively eliminating the friction points that historically limited online grocery adoption, with Australian Capital Territory and New South Wales leading at 34.5% regional share driven by Sydney’s dense population, advanced delivery infrastructure, and the concentration of fulfilment centre investment in the greater Sydney metropolitan area.

Australia Online Grocery Market Summary

  • The Australia online grocery market stood at USD 17,216 Million in 2025 and is projected to hit USD 96,585 Million by 2034 at a CAGR of 20.37%, driven by massive fulfilment centre automation, express delivery expansion, AI-powered personalisation, and permanent consumer behavioural shifts toward digital grocery shopping.
  • Woolworths’ online food sales exceeded AUD 9.1 billion in FY2025 with 16.2% online penetration, while Coles’ online sales surged 27.9% in Q1 FY26 with 13.3% penetration, and click-and-collect accounts for approximately 40% of online sales at both retailers.
  • Coles and Woolworths invested a combined AUD 200 million in fulfilment automation in 2024-2025, with Coles’ Witron-powered Truganina CFC (October 2024) and Woolworths’ AUD 60 million Adelaide hub and Heathwood Brisbane CFC (May 2025) expanding automated capacity.
  • App-based platforms dominate at 62.4% market share with 95%+ smartphone penetration, while hybrid marketplace models command 47.2% and Woolworths’ Everyday Rewards program has 10.2 million active members — over half of Australia’s adult population.
  • Amazon announced a AUD 750 million Brisbane facility (March 2026) creating 1,000+ jobs, expanded Amazon Fresh to 127+ additional Sydney suburbs, and partnered with Harris Farm Markets for fresh local product delivery, intensifying competition with incumbent retailers.

Australia Online Grocery Market Growth Drivers

Ultra-High Digital Connectivity and Smartphone Penetration Enabling Seamless Online Grocery Adoption

Australia’s exceptionally high levels of digital connectivity and smartphone penetration represent a fundamental enabler of online grocery market growth, providing the technological infrastructure and consumer digital fluency necessary for rapid adoption of app-based and web-based grocery shopping platforms. Australia has 25.94 million internet users representing 96.7% of the population as of February 2026, while smartphone penetration exceeds 95%, creating near-universal access to the mobile applications that dominate 62.4% of the online grocery market. Australian consumers spent AUD 69 billion on online purchases in 2024, with food and beverages accounting for AUD 13.6 billion, demonstrating the established digital commerce behaviour that online grocery platforms can build upon. The high smartphone penetration is particularly significant for the online grocery market because mobile apps enable features that drive adoption and repeat usage — including push notification alerts for delivery windows, real-time order tracking, barcode scanning for product reordering, digital shopping lists, and personalised promotional offers. Woolworths’ Everyday Rewards program — with 10.2 million active members as of February 2025 — exemplifies how digital loyalty ecosystems create powerful engagement loops that drive online grocery adoption, with AI-powered personalisation leveraging purchase data to deliver targeted offers and recommendations through mobile applications. The hybrid marketplace model commanding 47.2% of the market reflects how digital platforms enable retailers to extend their product range beyond traditional grocery through online marketplace partnerships, with Woolworths’ Everyday Market expanding available selection by end-2024. Australia’s advanced 4G and 5G mobile network infrastructure supports the bandwidth-intensive features of modern grocery apps — including high-resolution product imagery, video content, augmented reality, and real-time inventory availability — that enhance the online shopping experience and reduce barriers to adoption.

Intensifying Competitive Investment Creating Superior Consumer Propositions

The intensifying competitive investment among Woolworths, Coles, Amazon, and emerging players is creating a virtuous cycle of infrastructure development, service innovation, and consumer proposition improvement that is collectively accelerating online grocery market growth beyond what any single retailer could achieve independently. Woolworths and Coles’ combined AUD 200 million automation investment in 2024-2025 has enabled chilled-chain reliability within 2-hour delivery windows, addressing the quality and temperature integrity concerns that historically limited consumer willingness to purchase fresh, chilled, and frozen products online. Woolworths’ online food sales exceeding AUD 9.1 billion in FY2025 and Coles’ 27.9% online sales growth in Q1 FY26 demonstrate that this infrastructure investment is translating directly into consumer adoption and revenue growth. Amazon’s aggressive Australian expansion — extending Amazon Fresh to 127+ additional Sydney suburbs across 2024-2026, announcing a AUD 750 million Brisbane facility, and partnering with Harris Farm Markets for fresh local product delivery — is introducing competitive pressure that compels incumbent retailers to accelerate their own investment in delivery speed, product range, and pricing competitiveness. Coles’ December 2025 partnership with Uber Eats to expand 50%+ of its items for on-demand delivery, and its February 2025 Perth express delivery pilot targeting 60-minute windows, reflect the competitive imperative to match and exceed the delivery speed expectations being set by quick commerce entrants. This competitive dynamic is creating a market environment where service levels continuously improve, delivery windows shrink, product availability expands, and pricing remains competitive — all of which lower barriers to consumer adoption and drive the market’s extraordinary 20.37% CAGR growth trajectory. Woolworths achieving 100% renewable electricity by February 2026 and Amazon’s Melbourne sort centre receiving zero-carbon certification in March 2025 demonstrate that sustainability credentials are emerging as an additional competitive dimension as environmentally conscious consumers factor supply chain sustainability into their grocery purchasing decisions.

Australia Online Grocery Market Segments

The Australia online grocery market is comprehensively segmented across product type, business model, platform, purchase type, and region, providing a detailed framework for analysing growth opportunities and competitive dynamics across the digital grocery value chain.

  • Breakup by Product Type: The market encompasses staples and cooking essentials (25.8% share), vegetables and fruits, dairy products, snacks, meat and seafood, and others. Staples and cooking essentials lead with the highest repeat transaction frequency, while fresh categories including vegetables, fruits, meat, and seafood are growing rapidly as AI-enabled produce grading and chilled-chain automation address quality concerns.
  • Breakup by Business Model: The market includes hybrid marketplace (47.2% share), pure marketplace, and others. Hybrid marketplace models dominate as Woolworths and Coles leverage their physical store networks alongside dedicated customer fulfilment centres, while pure marketplace models are gaining traction through Amazon’s platform connecting consumers with specialty retailers like Harris Farm Markets.
  • Breakup by Platform: The market is divided into app-based (62.4% share) and web-based platforms. App-based platforms dominate driven by Australia’s 95%+ smartphone penetration, with mobile apps enabling push notifications, real-time order tracking, barcode scanning, and personalised promotional offers that drive higher engagement and repeat purchase rates.
  • Breakup by Purchase Type: The market encompasses one-time purchases (65.7% share) and subscription models. One-time purchases dominate reflecting the early-stage adoption of online grocery by many consumers, while subscription models present significant growth potential as express delivery capabilities and AI-powered automated replenishment reduce planning friction.
  • Breakup by Region: The market is segmented across Australian Capital Territory & New South Wales (34.5% share), Victoria & Tasmania, Queensland, Northern Territory & Southern Australia, and Western Australia. ACT & NSW leads driven by Sydney’s dense population, advanced delivery infrastructure, and the concentration of fulfilment centre investment including Woolworths’ Moorebank CFC and Amazon Fresh’s expanding suburban coverage.

Australia Online Grocery Market Competitive Landscape

The Australia online grocery market features a competitive landscape dominated by established supermarket chains expanding their digital capabilities alongside global e-commerce platforms and specialty grocery retailers. Key players operating in the market include Woolworths Group Limited, Coles Group Limited, Amazon Australia Pty Ltd, ALDI Australia, Metcash Limited (IGA, Foodland, Drakes), and Harris Farm Markets, among others. These companies compete through fulfilment centre automation, delivery speed and coverage, product range and freshness, pricing competitiveness, loyalty program engagement, app experience quality, and sustainability credentials to capture share in Australia’s rapidly expanding online grocery market.

Latest News & Development in the Australia Online Grocery Market

  • May 2025: Woolworths announced the development of its Heathwood Customer Fulfilment Centre in Brisbane using Witron automation technology, expanding its network of automated CFCs, while having earlier opened a AUD 60 million fulfilment hub in Adelaide joining its network of seven CFCs across Australia.
  • March 2025: Woolworths implemented an AI-enabled produce grading system at its Sydney fulfilment facility to support automated quality verification for home delivery orders, while Amazon’s Melbourne sort centre received zero-carbon certification, advancing sustainability in online grocery logistics.
  • February 2025: Coles launched a Perth express delivery pilot targeting 60-minute delivery windows, demonstrating the shift toward sub-hour grocery fulfilment as the retailer continues to expand its online service capabilities across Australian cities.
  • December 2024: Amazon Fresh extended to 47 additional Sydney suburbs, while Coles commissioned its Witron-powered automated facility in Truganina, Victoria, in October 2024, unlocking capacity for tens of thousands of automated daily order picks at substantially reduced operational cost.
  • 2024-2025: Amazon partnered with Harris Farm Markets to offer fresh local products through its platform, with Harris Farm fulfilling orders from stores and Amazon Flex handling last-mile delivery, while Coles partnered with Uber Eats (December 2025) to expand 50%+ of Coles items for on-demand delivery.

Note: If you require any specific information not currently covered within the scope of the report, IMARC Group will provide it as part of customization.
Speak to an analyst:

Australia Data Center Construction Market Size, Share, Report 2026-2034

Australia Data Center Construction Market Overview

The Australia data center construction market is experiencing unprecedented growth, driven by explosive AI workload demand, massive hyperscale and cloud provider investment commitments, the rapid expansion of colocation capacity, critical power infrastructure development, and the country’s emergence as the Asia-Pacific region’s second most attractive data centre investment destination after the United States. The Australia data center construction market size was valued at USD 1.30 Billion in 2025, reflecting the intensity of construction activity required to support the nation’s digital infrastructure expansion. Australia’s total data centre occupancy expanded from 37 MW in 2005 to 1.3 GW in 2025, with deployable capacity projected to more than double to over 3,100 MW by 2030, requiring approximately AUD 26 billion in new investment. Electrical construction dominates at 55.7% of the market, driven by the critical power and cooling infrastructure requirements of modern high-density facilities. Large data centres represent 44.3% by facility type, while Tier III facilities — offering concurrent maintainability — command 46.8% by tier standard. The IT and telecommunications vertical leads at 31.9% market share, supported by 80% of Australian businesses planning cloud migration within two years. Australian Capital Territory and New South Wales account for 37.4% of the market, with Sydney’s pre-committed capacity reaching 72% of new supply as hyperscale customers drive approximately 80% of new demand. Between 2023 and 2025, companies announced data centre investments in Australia that could scale up to more than AUD 100 billion, with data centres currently consuming 5% of national electricity generation — projected to reach 8% by 2030.

Looking forward, the Australia data center construction market is projected to reach USD 2.29 Billion by 2034, growing at a CAGR of 5.93% from 2026-2034. This growth trajectory is being supported by transformative investment commitments from global technology giants, institutional investor acquisitions, and domestic operator expansion programs. Amazon committed AUD 20 billion by 2029 to expand Australian data centre infrastructure, while Microsoft pledged AUD 5 billion for cloud and AI capacity. In September 2024, Blackstone acquired AirTrunk — Australia’s largest data centre operator — for AUD 24 billion, validating the sector’s earnings potential. In December 2025, OpenAI partnered with NEXTDC to build a AUD 7 billion large-scale computing cluster in Sydney, accelerating AI infrastructure deployment. NEXTDC commenced construction on its 550 MW S7 Sydney campus with capacity delivery through 2029, while the M4 Melbourne campus represents a AUD 2 billion investment announced in June 2025. CDC Data Centers broke ground on a hyperscale campus in Western Sydney’s Marsden Park set to become the Southern Hemisphere’s largest data centre. Partners Group invested AUD 1.2 billion in GreenSquareDC, while Amazon announced a AUD 750 million Brisbane facility in March 2026. The Victorian government fast-tracked NEXTDC’s Port Melbourne campus, valued at approximately AUD 2 billion, reflecting state-level recognition of data centre infrastructure as critical economic development. Construction costs in Sydney range between AUD 10-11 per watt and in Melbourne AUD 9.50-10 per watt, while modular construction methods are compressing build timelines by up to 30%.

Request for a sample copy of this report: https://www.imarcgroup.com/australia-data-center-construction-market/requestsample

How AI is Reshaping the Future of the Australia Data Center Construction Market

Artificial intelligence is simultaneously the primary demand catalyst and a transformative construction methodology for Australia’s data centre industry, with AI workloads driving unprecedented power density requirements while AI-powered tools revolutionise facility design, construction management, and operational optimisation. AI adoption has the potential to contribute AUD 600 billion annually to Australia’s GDP by 2030, creating massive infrastructure demand. Key developments include:

•         AI Workloads Driving Unprecedented Power Density and Facility Design Innovation: The explosive growth of AI training and inference workloads is fundamentally reshaping data centre construction specifications, as GPU-intensive computing requires power densities of 30-60+ kW per rack — compared to traditional 5-10 kW per rack for conventional IT workloads — with emerging configurations reaching 80+ kW per rack. This 6-10x increase in power density is driving radical facility design innovation, requiring higher-capacity electrical infrastructure, advanced liquid cooling systems, and more sophisticated heat rejection capabilities. OpenAI’s AUD 7 billion partnership with NEXTDC to build a large-scale computing cluster in Sydney exemplifies the scale of AI-specific infrastructure demand, while Amazon’s AUD 20 billion commitment and Microsoft’s AUD 5 billion pledge are substantially driven by AI and machine learning capacity requirements.

•         AI-Powered Construction Planning and Building Information Modelling: AI and machine learning are transforming data centre construction planning by enhancing Building Information Modelling (BIM) with predictive analytics, clash detection, and construction sequencing optimisation. AI-powered BIM systems can simulate thousands of design configurations to identify optimal electrical and mechanical layouts, predict construction conflicts before they occur, and generate construction schedules that minimise critical path duration. Modular construction methods — increasingly designed using AI-optimised prefabrication processes — are compressing data centre build timelines by up to 30%, a critical capability when capacity delivery speed determines competitive positioning in a market where 72% of Sydney’s new supply is already pre-committed.

•         Advanced Liquid Cooling and AI-Optimised Thermal Management Systems: The transition from air-cooled to liquid-cooled data centre architectures — driven by AI workload density — is creating new construction requirements and methodologies that are being optimised using AI-powered thermal modelling. AI systems simulate airflow patterns, heat dissipation characteristics, and cooling efficiency across facility designs to optimise the placement of cooling infrastructure, minimise hot spots, and achieve Power Usage Effectiveness (PUE) targets of 1.3 or lower as mandated by government guidelines. Delta Electronics’ installation of 12 prefabricated modular cooling units in January 2024 demonstrates the shift toward AI-optimised, modular cooling solutions that can be rapidly deployed to support high-density AI workloads.

•         AI-Driven Power Infrastructure Planning and Grid Integration: AI-powered energy modelling tools are becoming essential for data centre construction planning as grid connection timeline delays of 2-3 years in major Australian metros create critical path constraints. AI systems analyse grid capacity, renewable energy availability, battery storage integration options, and load forecasting to optimise power infrastructure design and facilitate grid connection approvals. With data centres currently consuming 5% of national electricity generation — projected to reach 8% by 2030 — and Australia’s Energy Market Operator accounting for electricity demand from data centres to triple by 2030, AI-powered power planning is essential for ensuring that new facilities can secure adequate and reliable power supply.

•         Digital Twin Technology and AI-Powered Commissioning: AI-powered digital twin technology is transforming data centre commissioning and operational handover by creating virtual replicas of facilities that enable comprehensive testing, scenario modelling, and performance optimisation before physical systems are activated. These digital twins integrate real-time sensor data with AI prediction models to identify potential failure points, optimise system configurations, and validate that constructed facilities will meet their design specifications for power delivery, cooling capacity, and redundancy. The technology is particularly valuable for Tier III and Tier IV facilities — which together represent the dominant share of Australian construction — where concurrent maintainability and fault tolerance requirements demand rigorous verification of complex redundant systems.

Australia Data Center Construction Market Trends

Hyperscale Campus Development and Institutional Capital Influx Transforming the Construction Pipeline

The convergence of hyperscale campus development by global cloud providers and massive institutional capital investment in data centre platforms represents the most significant trend reshaping Australia’s data centre construction market, creating a construction pipeline of unprecedented scale and complexity. Blackstone’s AUD 24 billion acquisition of AirTrunk in September 2024 — the largest data centre transaction globally — validated Australia as a premier data centre investment destination and unlocked significant capital for AirTrunk’s expansion program, including the 354 MW MEL2 Melbourne campus approved for construction with initial power-on slated for mid-2026. Partners Group invested AUD 1.2 billion in GreenSquareDC, while the October 2024 acquisition of Global Switch Australia for USD 1.937 billion further demonstrated institutional investor appetite for Australian data centre assets. NEXTDC commenced construction on its 550 MW S7 Sydney campus — a multi-phase hyperscale build program delivering capacity through 2029 — while announcing the AUD 2 billion M4 Melbourne campus in June 2025 and partnering with OpenAI for a AUD 7 billion Sydney computing cluster in December 2025. CDC Data Centers broke ground on a hyperscale campus in Western Sydney’s Marsden Park that will become the Southern Hemisphere’s largest data centre, drawing more electricity than 140,000 homes. Project Southgate targets 1.8 gigawatts of capacity by 2028, while Project Meridien proposes a one-gigawatt AI facility south of Broome that would place Australia in the same gigawatt class as the world’s largest data centres. Melbourne, with approximately half Sydney’s capacity, is experiencing the fastest growth rate nationwide as operators including NEXTDC and AirTrunk develop major new campuses, with the Victorian government fast-tracking approvals to accelerate construction timelines.

Power and Energy Infrastructure Challenges Driving Construction Innovation

The critical challenge of securing adequate, reliable, and sustainable power supply for the rapidly expanding Australian data centre sector is emerging as the most consequential constraint — and simultaneously the most significant driver of construction innovation — in the market, as grid connection delays of 2-3 years in major metros force operators and construction firms to develop creative power infrastructure solutions. Data centres currently consume 5% of Australia’s national electricity generation, with projections indicating this will reach 8% by 2030 as deployable capacity more than doubles from 1.3 GW to over 3,100 MW. Australia’s Energy Market Operator is accounting for electricity demand from data centres to triple by 2030, creating urgent requirements for grid augmentation, renewable energy development, and on-site power generation that are reshaping the scope and complexity of data centre construction projects. The electrical construction segment’s dominance at 55.7% of the market reflects the critical importance and cost intensity of power infrastructure in modern data centre builds, particularly as AI workload densities escalate from traditional 5-10 kW per rack to 30-60+ kW and emerging 80+ kW per rack configurations. Telstra and Accenture formed a AUD 700 million joint venture approved in April 2025, addressing the infrastructure and connectivity requirements of the expanding data centre ecosystem. Construction firms are increasingly incorporating on-site renewable energy generation, battery energy storage systems, and behind-the-meter power purchase agreements into facility designs to reduce grid dependence and accelerate time-to-power. The government’s PUE target of 1.3 or lower is driving adoption of advanced cooling technologies including direct liquid cooling, immersion cooling, and rear-door heat exchangers that reduce the power overhead of thermal management, while simultaneously increasing construction complexity and cost. Firmus Technologies secured USD 327 million in funding in November 2025 for data centre development, reflecting the capital intensity of building power-optimised facilities that can meet both current demand and future AI workload scaling requirements.

Australia Data Center Construction Market Summary

•         The Australia data center construction market was valued at USD 1.30 Billion in 2025 and is projected to reach USD 2.29 Billion by 2034 at a CAGR of 5.93%, with total occupancy expanding from 37 MW (2005) to 1.3 GW (2025) and projected to exceed 3,100 MW by 2030.

•         Amazon committed AUD 20 billion by 2029 and Microsoft pledged AUD 5 billion, while Blackstone acquired AirTrunk for AUD 24 billion (September 2024) and OpenAI partnered with NEXTDC for a AUD 7 billion Sydney computing cluster (December 2025).

•         Electrical construction dominates at 55.7%, with AI workloads driving power densities to 30-60+ kW per rack — up from traditional 5-10 kW — while data centres consume 5% of national electricity generation, projected to reach 8% by 2030.

•         ACT & NSW leads at 37.4% regional share with 72% of Sydney’s new supply pre-committed, while Melbourne is the fastest-growing market and construction costs range AUD 10-11/watt in Sydney and AUD 9.50-10/watt in Melbourne.

•         NEXTDC commenced its 550 MW S7 Sydney campus and CDC broke ground on the Southern Hemisphere’s largest data centre in Western Sydney, while modular construction methods are compressing build timelines by up to 30% across major projects.

Australia Data Center Construction Market Growth Drivers

Explosive AI Workload Growth and Cloud Migration Creating Unprecedented Capacity Demand

The explosive growth of artificial intelligence workloads — combined with the accelerating migration of Australian enterprises to cloud computing platforms — represents the primary structural demand driver for data centre construction, creating capacity requirements that far exceed the existing infrastructure base and necessitate sustained investment in new facility construction over the forecast period. AI adoption has the potential to contribute AUD 600 billion annually to Australia’s GDP by 2030, generating massive demand for the computing infrastructure required to train, deploy, and run AI models at scale. The transition from traditional computing workloads requiring 5-10 kW per rack to AI training and inference workloads requiring 30-60+ kW per rack — with emerging GPU configurations reaching 80+ kW per rack — means that each megawatt of AI capacity requires fundamentally different and more expensive construction than traditional data centre builds. OpenAI’s AUD 7 billion partnership with NEXTDC to build a large-scale computing cluster in Sydney, Amazon’s AUD 20 billion commitment by 2029, and Microsoft’s AUD 5 billion pledge are primarily driven by the need to build AI and cloud computing infrastructure in the Australian market. Enterprise cloud adoption is accelerating rapidly, with 80% of Australian businesses planning cloud migration within two years, creating sustained demand for colocation and hyperscale capacity across all major metropolitan markets. The IT and telecommunications vertical’s 31.9% market share reflects the foundational role of technology infrastructure providers in driving construction demand, while financial services, healthcare, government, and media verticals are generating incremental demand as they migrate workloads to cloud environments and deploy AI-powered applications. Hyperscale customers account for roughly 80% of new demand in Sydney, driving the development of large campus-style data centres that require multi-year construction programs and billions of dollars in investment.

Institutional Capital and Global Technology Investment Fuelling Construction Pipeline Expansion

The massive influx of institutional capital and global technology company investment into Australia’s data centre sector is creating a construction pipeline of unprecedented scale, providing the financial resources necessary to fund the multi-billion-dollar developments required to meet rapidly growing capacity demand. Between 2023 and 2025, companies announced data centre investments in Australia that could scale up to more than AUD 100 billion, transforming the country’s digital infrastructure landscape. Blackstone’s AUD 24 billion acquisition of AirTrunk in September 2024 — the world’s largest data centre transaction — demonstrated the institutional investor conviction in Australian data centre assets and unlocked significant expansion capital. Partners Group’s AUD 1.2 billion investment in GreenSquareDC and the AUD 1.937 billion acquisition of Global Switch Australia in October 2024 further validated the sector’s investment thesis. Australia ranked second globally in 2024 as the most attractive destination for data centre investment, behind only the United States, reflecting the country’s stable political environment, established rule of law, skilled construction workforce, growing renewable energy supply, and strategic geographic position as a gateway to Asia-Pacific markets. The formation of Data Centres Australia — a peak body launched following a two-year pilot between AirTrunk, AWS, CDC Data Centres, Microsoft, and NEXTDC — reflects the sector’s maturation and its collective commitment to addressing the planning, energy, water, and workforce development challenges that could constrain construction activity. Macquarie Telecom’s IC3 Super West expansion represents a AUD 350 million investment creating over 1,200 jobs, while its Sydney IC3 campus delivers 63 MW total IT load, demonstrating the scale of individual facility investments. State governments are actively facilitating construction through fast-tracked planning approvals — as demonstrated by Victoria’s acceleration of NEXTDC’s Port Melbourne campus — recognising data centres as critical economic infrastructure that attracts technology investment, creates construction and operational employment, and positions Australia as a digital economy leader.

Australia Data Center Construction Market Segments

The Australia data center construction market is comprehensively segmented across construction type, data center type, tier standard, vertical market, and region, providing a detailed framework for analysing growth opportunities and competitive dynamics across the data centre construction value chain.

•         Breakup by Construction Type: The market encompasses electrical construction (55.7% share) and mechanical construction. Electrical construction dominates driven by the critical power infrastructure requirements of high-density AI workloads, including power distribution units, uninterruptible power supplies, generators, switchgear, and grid connection infrastructure.

•         Breakup by Data Center Type: The market includes large data centers (44.3% share), enterprise data centers, and mid-size data centers. Hyperscale campuses commanded 60.13% of market share in 2025, with colocation providers holding 55.08% as operators like NEXTDC, AirTrunk, and CDC drive large-scale campus development.

•         Breakup by Tier Standard: The market is segmented into Tier III (46.8% share), Tier IV, and Tier I and II. Tier III facilities dominate driven by their concurrent maintainability specification that allows maintenance without service interruption, while Tier IV facilities are the fastest-growing segment at 5.46% CAGR as mission-critical AI workloads demand fault-tolerant infrastructure.

•         Breakup by Vertical Market: The market serves IT and telecommunications (31.9% share), banking/financial services/insurance, public sector, healthcare, media and entertainment, retail, oil and energy, and others. IT and telecommunications leads driven by hyperscale cloud provider expansion, while BFSI represents a high-growth vertical requiring Tier III/IV reliability for financial transaction processing and regulatory compliance.

•         Breakup by Region: The market is segmented across Australian Capital Territory & New South Wales (37.4% share), Victoria & Tasmania, Queensland, Northern Territory & Southern Australia, and Western Australia. ACT & NSW dominates with 72% of Sydney’s new supply pre-committed, while Melbourne is the fastest-growing market with construction costs of AUD 9.50-10 per watt compared to Sydney’s AUD 10-11 per watt.

Australia Data Center Construction Market Competitive Landscape

The Australia data center construction market features a competitive landscape comprising data centre operators commissioning builds, global technology companies developing hyperscale campuses, specialist construction firms, and critical infrastructure suppliers. Key players operating in the market include NextDC Limited, AirTrunk (Blackstone), CDC Data Centers, Macquarie Data Centers, Amazon Web Services, Microsoft, Google Cloud, Equinix, Stack Infrastructure, DCI Data Centers, GreenSquareDC (Partners Group), Multiplex, BESIX Watpac, Delta Electronics, Siemens, Telstra, and Firmus Technologies, among others. These companies compete through capacity scale, construction delivery speed, power availability, cooling innovation, tier certification, location strategy, sustainability credentials, and customer relationships to serve Australia’s rapidly expanding data centre infrastructure requirements.

Latest News & Development in the Australia Data Center Construction Market

•         December 2025: OpenAI partnered with NEXTDC to build a AUD 7 billion large-scale computing cluster in Sydney, accelerating AI infrastructure deployment in the Asia-Pacific region, while NEXTDC also commenced construction on its 550 MW S7 Sydney hyperscale campus.

•         November 2025: Firmus Technologies secured USD 327 million in funding for data centre development, while the Victorian government fast-tracked NEXTDC’s approximately AUD 2 billion Port Melbourne campus to accelerate data centre construction in Melbourne.

•         June 2025: NEXTDC announced its AUD 2 billion M4 Melbourne data centre campus, while the Telstra-Accenture AUD 700 million joint venture was approved in April 2025 to address infrastructure and connectivity requirements of the expanding data centre ecosystem.

•         September 2024: Blackstone acquired AirTrunk for AUD 24 billion — the world’s largest data centre transaction — while Global Switch Australia was acquired for USD 1.937 billion in October 2024, demonstrating unprecedented institutional investor appetite for Australian data centre assets.

•         2024-2025: CDC Data Centers broke ground on the Southern Hemisphere’s largest data centre in Western Sydney’s Marsden Park, AirTrunk secured approval for its 354 MW MEL2 Melbourne campus, and Data Centres Australia launched as the industry’s peak body with backing from AirTrunk, AWS, CDC, Microsoft, and NEXTDC.

Note: If you require any specific information not currently covered within the scope of the report, IMARC Group will provide it as part of customization.

Speak to an analyst:

https://www.imarcgroup.com/request?type=report&id=24635&flag=E

Australia Cutlery Market 2026 | Worth USD 372.0 Million by 2034

Australia Cutlery Market Overview

The Australia cutlery market is experiencing significant growth, driven by the convergence of rising consumer demand for premium and designer tableware, the nationwide transition toward sustainable and eco-friendly materials following single-use plastic bans, the expanding hospitality and foodservice industry, and the growing influence of culinary culture and food presentation aesthetics on household purchasing decisions. The Australia cutlery market size reached USD 174.5 Million in 2025, reflecting the structural shift in consumer preferences toward higher-quality, aesthetically refined, and environmentally responsible cutlery products. Growing environmental consciousness has pushed 68% of Australian households to choose eco-friendly kitchenware, with stainless steel and ceramic-coated products seeing 35% higher sales compared to traditional alternatives. The Australia commercial tableware services market generated USD 372.1 million in revenue in 2024, with dinnerware capturing a 63.91% revenue share, underscoring the strong demand across both household and commercial hospitality channels. Australia’s comprehensive single-use plastic bans — with all states and territories implementing phased prohibitions on plastic straws, cutlery, plates, and food containers — have catalysed a fundamental market transformation from disposable to reusable and biodegradable cutlery categories.

Looking forward, the Australia cutlery market is expected to reach USD 372.0 Million by 2034, exhibiting a growth rate (CAGR) of 8.51% during 2026-2034. This robust growth trajectory is being supported by the premiumisation of dining experiences, the expansion of online retail and personalisation options, the influence of celebrity chef collaborations on consumer purchasing, and the sustained growth of Australia’s hospitality sector. In June 2024, Spotlight launched The Culinary Co by Manu — an exclusive kitchenware range designed in collaboration with celebrity chef Manu Feildel — featuring cookware, cutlery, knife blocks, dinnerware, and stylish dinner sets that blend culinary functionality with premium design aesthetics. In March 2025, Perth agency Block launched Side by Side, a content platform for Kitchen Warehouse’s Wolstead cookware brand, highlighting the Steeltek Ultra range. The broader Australia kitchenware market reached USD 4,091.5 million in 2025 and is expected to reach USD 6,815.2 million by 2034 at a CAGR of 5.66%, providing strong tailwinds for cutlery as a core product category within the expanding kitchenware ecosystem. The growth of online retail channels, personalisation and customisation options including monogrammed and bespoke cutlery sets, and the rising influence of social media food presentation culture are creating new demand vectors that complement the traditional household and hospitality replacement cycles.

Request for a sample copy of this report: https://www.imarcgroup.com/australia-cutlery-market/requestsample

How AI is Reshaping the Future of the Australia Cutlery Market

Artificial intelligence is increasingly influencing the Australian cutlery market across product design, manufacturing precision, retail personalisation, supply chain management, and consumer trend forecasting. As the market shifts toward premiumisation, sustainability, and digital commerce, AI is enabling manufacturers and retailers to deliver more innovative, personalised, and efficiently produced products. Key developments include:

  • AI-Driven Product Design and Material Innovation: Machine learning algorithms are accelerating the development of new cutlery designs by analysing ergonomic data, consumer preference patterns, dining trend aesthetics, and material science properties to optimise blade geometry, handle comfort, weight balance, and visual appeal. Generative AI design tools enable manufacturers to create and iterate hundreds of design variations rapidly, testing combinations of stainless steel alloys, silver finishes, and sustainable materials like bamboo and recycled composites to identify products that satisfy both functional performance and aesthetic preferences of Australian consumers.
  • Smart Manufacturing and Quality Control Automation: AI-powered computer vision systems are transforming cutlery manufacturing quality control by inspecting every piece for surface defects, dimensional accuracy, polishing consistency, and material integrity at speeds far exceeding manual inspection. These systems detect micro-scratches, coating irregularities, and structural flaws that are invisible to the human eye, ensuring that premium and luxury cutlery products meet the exacting quality standards demanded by Australian consumers and high-end restaurant operators who are willing to pay premium prices for flawless craftsmanship.
  • AI-Powered Personalisation and E-Commerce Recommendation: Machine learning recommendation engines on online retail platforms are analysing consumer browsing behaviour, purchase history, dining style preferences, and home décor aesthetics to deliver personalised cutlery product recommendations that increase conversion rates and average order values. AI enables mass customisation at scale — from monogrammed cutlery sets to bespoke wedding and gift registries — by optimising production scheduling and engraving processes to handle individualised orders efficiently without sacrificing margins.
  • Predictive Trend Forecasting and Demand Planning: Natural language processing and image recognition AI systems are mining social media platforms, food blogs, restaurant review sites, and cooking show content to identify emerging tableware and dining presentation trends before they reach mainstream adoption. These predictive insights enable cutlery manufacturers and retailers to align product development, inventory planning, and marketing campaigns with anticipated demand shifts — such as the growing influence of Japandi aesthetics, matte-finish flatware, or mixed-metal table settings — reducing overstock risk and improving time-to-market for trend-responsive collections.
  • AI-Optimised Sustainable Material Sourcing and Lifecycle Assessment: AI platforms are enabling cutlery manufacturers to optimise sustainable material sourcing by analysing global supply chain data for ethically sourced stainless steel, recycled metals, FSC-certified bamboo, and biodegradable composites. Machine learning lifecycle assessment tools calculate the environmental footprint of different cutlery materials and manufacturing processes, enabling brands to substantiate sustainability claims with data-driven credibility and comply with Australia’s evolving environmental packaging and product regulations across all states and territories.

Australia Cutlery Market Trends

Single-Use Plastic Bans Catalysing a Structural Shift Toward Sustainable Cutlery Categories

Australia’s comprehensive single-use plastic ban framework represents the most significant regulatory catalyst in the cutlery market’s recent history, driving a fundamental structural transformation from disposable plastic cutlery toward reusable, biodegradable, and sustainably manufactured alternatives across both household and commercial channels. All Australian states and territories have implemented phased prohibitions on single-use plastic cutlery, straws, stirrers, plates, and food containers — South Australia led the initiative from March 2021, Western Australia fast-tracked its phase-out starting July 2022, and New South Wales and Queensland have banned plastic straws, cutlery, and foam food containers. South Australia’s latest regulations, effective September 2025, extend to plastic soy sauce fish, attached cutlery including straws, and expanded polystyrene food packaging, demonstrating the progressive tightening of restrictions that continues to expand the scope of banned products. Importantly, items containing compostable plastic or “plant-based” plastic are also prohibited in several jurisdictions, directing demand specifically toward paper, wood, bamboo, and durable reusable alternatives rather than bioplastic substitutes. This regulatory landscape has created powerful demand tailwinds for stainless steel, silver, gold-plated, and premium reusable cutlery in household applications, while the hospitality sector is investing in higher-quality commercial-grade flatware that withstands heavy use and repeated dishwashing. The 68% of Australian households now choosing eco-friendly kitchenware reflects the cultural normalisation of sustainability considerations in purchasing decisions, while stainless steel and ceramic-coated products are seeing 35% higher sales as consumers upgrade from disposable to durable alternatives. The ban has particularly accelerated growth in the bamboo and wooden cutlery segment for foodservice and catering applications, creating a new market category that barely existed before regulatory intervention.

Premiumisation and Culinary Culture Driving Consumer Upgrade Cycles

The premiumisation of dining experiences — both at home and in commercial hospitality settings — is driving a sustained consumer upgrade cycle in the Australian cutlery market, as rising incomes, culinary awareness, and social media-influenced food presentation culture elevate cutlery from a functional necessity to a design statement and lifestyle accessory. The influence of celebrity chef culture is directly shaping purchasing patterns — Spotlight’s June 2024 launch of The Culinary Co by Manu, an exclusive kitchenware range designed with celebrity chef Manu Feildel, integrates premium cutlery alongside cookware, knife blocks, and dinnerware as a complete culinary lifestyle offering. Kitchen Warehouse’s Wolstead brand launched the Side by Side content platform in March 2025 to showcase premium product ranges, reflecting the growing importance of brand storytelling and experiential marketing in converting consumers to higher-priced cutlery and kitchenware products. The high-end restaurant segment is driving demand for designer flatware that complements sophisticated plating and presentation trends, with fine dining establishments investing in premium stainless steel, silver, and gold-accented cutlery that enhances the visual and tactile dining experience. Williams Sonoma reported 45% growth in sustainable cookware lines, while Nisbets saw its eco-range become its fastest-growing segment — both indicators of the intersection between premiumisation and sustainability that characterises the contemporary Australian cutlery consumer. The household segment is benefiting from the home cooking renaissance that accelerated during the pandemic and has become a permanent lifestyle shift, with consumers investing in complete tableware collections that match their kitchen aesthetics and entertaining aspirations. Online retail personalisation — including monogrammed sets, custom engraving, and curated wedding and gift registries — is adding premium pricing opportunities and emotional value to cutlery purchases. The broader Australia kitchenware market’s growth to USD 4,091.5 million in 2025, with projections to reach USD 6,815.2 million by 2034, confirms the structural consumer appetite for premium kitchen and dining products that is sustaining the cutlery market’s above-average growth rate.

Australia Cutlery Market Summary

  • The Australia cutlery market reached USD 174.5 Million in 2025 and is projected to reach USD 372.0 Million by 2034 at a CAGR of 8.51%, driven by single-use plastic bans, premiumisation of dining culture, sustainability trends, and online retail personalisation.
  • 68% of Australian households now choose eco-friendly kitchenware, with stainless steel and ceramic-coated products seeing 35% higher sales, reflecting the cultural normalisation of sustainability in consumer purchasing decisions.
  • All Australian states and territories have implemented phased single-use plastic cutlery bans, with South Australia extending restrictions to attached cutlery and EPS packaging from September 2025, catalysing demand for reusable and biodegradable alternatives.
  • The Australia commercial tableware services market generated USD 372.1 million in 2024, with dinnerware holding a 63.91% revenue share, underscoring the strong hospitality and foodservice demand for premium commercial-grade cutlery.
  • The broader Australia kitchenware market reached USD 4,091.5 million in 2025, projected to reach USD 6,815.2 million by 2034 at 5.66% CAGR, providing strong growth tailwinds for cutlery as a core product category within the expanding kitchenware ecosystem.

Australia Cutlery Market Growth Drivers

Expanding Hospitality Sector and Foodservice Industry Driving Commercial Cutlery Demand

Australia’s expanding hospitality and foodservice industry is a primary structural driver of cutlery market growth, as the growing number of restaurants, cafés, hotels, catering operations, and food delivery services generates sustained demand for commercial-grade cutlery that combines durability, design appeal, and compliance with evolving sustainability regulations. The commercial tableware services market generated USD 372.1 million in revenue in 2024 and is expected to reach USD 528.3 million by 2030 at a CAGR of 6.1%, reflecting the scale of investment flowing into hospitality tableware. The high-end restaurant segment is particularly influential, as fine dining establishments invest in premium stainless steel, silver-plated, and designer flatware that enhances the visual and tactile dining experience in alignment with sophisticated plating and culinary presentation trends driven by celebrity chef culture. The expansion of casual dining chains, fast-casual concepts, and food halls is creating demand across the mid-market cutlery segment for products that balance aesthetic appeal with commercial durability — withstanding hundreds of dishwashing cycles without degradation in appearance or structural integrity. Australia’s single-use plastic cutlery bans are directly impacting the foodservice segment by eliminating disposable plastic options and redirecting demand toward wooden, bamboo, and reusable alternatives that comply with state-by-state regulations. Catering companies and event organisers are upgrading to premium reusable cutlery sets that enhance presentation quality while reducing per-event waste costs over time. The growth of food delivery services and ghost kitchens is creating demand for sustainable takeaway cutlery solutions — paper, wooden, and bamboo options — that maintain food safety standards while meeting regulatory compliance across all Australian jurisdictions.

Online Retail Growth and Personalisation Options Expanding Consumer Access and Premium Demand

The rapid growth of online retail channels and the increasing availability of personalisation and customisation options are expanding consumer access to premium cutlery products while creating new demand vectors that drive market growth beyond traditional household replacement cycles. E-commerce platforms are transforming the cutlery purchase journey by offering consumers access to a vastly wider range of products, brands, and price points than traditional brick-and-mortar retail, enabling comparison shopping, customer review-driven decision-making, and exposure to international and boutique brands that were previously unavailable in the Australian market. AI-powered recommendation engines are increasing conversion rates by matching consumers with cutlery products that align with their dining style, kitchen décor, and budget preferences, while social media integration enables direct purchase pathways from food styling inspiration to product acquisition. The personalisation segment — including monogrammed flatware, custom-engraved pieces, and bespoke cutlery sets for weddings, corporate gifts, and milestone celebrations — represents a high-margin growth opportunity that online platforms are uniquely positioned to serve at scale. Digital customisation tools allow consumers to visualise personalised designs, select from multiple font styles and engraving positions, and preview finished products before purchase, reducing friction and increasing confidence in premium personalised orders. The growth of curated subscription boxes and seasonal tableware collections delivered through e-commerce channels is creating recurring revenue opportunities and accelerating product discovery for emerging and artisanal cutlery brands. Direct-to-consumer brands are leveraging social media marketing, influencer partnerships, and content platforms to build brand awareness and emotional connections with design-conscious Australian consumers who view cutlery as an expression of personal taste and lifestyle values.

Australia Cutlery Market Segments

The Australia cutlery market is comprehensively segmented across product type, distribution channel, application, and region, providing a detailed framework for analysing growth opportunities and competitive dynamics across the industry value chain.

  • Breakup by Product Type: The market is segmented into plastic, stainless steel, silver, and gold categories. Stainless steel dominates the market due to its combination of durability, corrosion resistance, aesthetic versatility, and affordability across both household and commercial applications, while the silver and gold segments cater to the premium and luxury dining market driven by gifting, wedding registries, and high-end hospitality demand.
  • Breakup by Distribution Channel: The market is divided into online and offline channels. The online segment is experiencing the fastest growth driven by e-commerce expansion, personalisation capabilities, wider product selection, and competitive pricing, while offline channels including department stores, specialty kitchenware retailers, and hospitality suppliers maintain strong market presence through tactile product experience and professional consultation services.
  • Breakup by Application: The market encompasses household, public consumption restaurant, and high-end restaurant segments. The household segment represents the largest application category driven by home cooking trends and dining culture, while the high-end restaurant segment commands premium pricing and drives design innovation that eventually cascades into mainstream product development.
  • Breakup by Region: The market is segmented across Australian Capital Territory & New South Wales, Victoria & Tasmania, Queensland, Northern Territory & Southern Australia, and Western Australia. New South Wales and Victoria lead in market share driven by the concentration of Australia’s largest hospitality sectors in Sydney and Melbourne, higher urbanisation rates, and greater consumer spending on premium household and dining products.
  • Breakup by Sustainability: The market is increasingly shaped by sustainability segmentation, with 68% of Australian households opting for eco-friendly kitchenware. The phased single-use plastic bans across all states and territories have created distinct demand categories for reusable premium cutlery, biodegradable disposable alternatives (wood, bamboo, paper), and sustainable material innovations that comply with evolving regulatory frameworks.

Australia Cutlery Market Competitive Landscape

The Australia cutlery market features a competitive landscape comprising international premium brands, domestic manufacturers, hospitality suppliers, and emerging direct-to-consumer labels. Key players operating in the market include Robert Welch Designs, Stanley Rogers, Furi, Wiltshire, Wolstead, Noritake, Christofle, Georg Jensen, Williams Sonoma, Nisbets Australia, Kitchen Warehouse, Spotlight Group, and various artisanal and boutique cutlery brands, among others. These companies compete through product design innovation, material quality, brand heritage, sustainability credentials, pricing strategy, and retail channel presence to serve the diverse requirements of Australian households, hospitality operators, and gifting consumers.

Latest News & Development in the Australia Cutlery Market

  • September 2025: South Australia extended its single-use plastic regulations to prohibit plastic soy sauce fish, attached cutlery including straws, and expanded polystyrene food packaging from sale, supply, or distribution, further strengthening demand for sustainable cutlery alternatives across the foodservice sector.
  • March 2025: Perth agency Block launched Side by Side, a dedicated content platform for Kitchen Warehouse’s Wolstead cookware and cutlery brand, spotlighting the quality and value of the Steeltek Ultra range and reflecting the growing importance of brand storytelling in premium kitchenware marketing.
  • June 2024: Spotlight launched The Culinary Co by Manu, an exclusive kitchenware range designed in collaboration with celebrity chef Manu Feildel, featuring cookware, cutlery, knife blocks, dinnerware, cast iron pots and pans, chopping boards, and stylish dinner sets.
  • 2024: Williams Sonoma reported 45% growth in sustainable cookware and cutlery lines across its Australian retail operations, while Nisbets saw its eco-friendly range become its fastest-growing product segment, confirming the consumer shift toward environmentally responsible kitchenware.
  • 2024-2025: All Australian states and territories continued implementing phased single-use plastic bans, with NSW, Queensland, Western Australia, and South Australia progressively tightening restrictions on plastic cutlery, straws, and food containers, driving sustained demand growth for reusable and biodegradable alternatives.

Note: If you require any specific information not currently covered within the scope of the report, IMARC Group will provide it as part of customization.
Speak to an analyst:

https://www.imarcgroup.com/request?type=report&id=35160&flag=E

Australia Molecular Diagnostics Market 2026 | Worth USD 1,153.8 Million by 2034

Australia Molecular Diagnostics Market Overview

The Australia molecular diagnostics market is experiencing robust growth, driven by the national healthcare system’s strategic pivot toward precision medicine, expanding genomic research infrastructure, and increasing adoption of advanced testing technologies across oncology, infectious diseases, and genetic screening applications. The Australia molecular diagnostics market size reached USD 625.6 Million in 2025, reflecting the accelerating integration of PCR, next-generation sequencing (NGS), and digital PCR platforms into routine clinical workflows across hospitals and diagnostic laboratories. The pathology services sector, valued at AUD 5.7 billion in 2026 and dominated by Sonic Healthcare, Healius, and Australian Clinical Labs, provides the institutional backbone for molecular testing deployment at scale.

Looking forward, the Australia molecular diagnostics market is expected to reach USD 1,153.8 Million by 2034, exhibiting a growth rate (CAGR) of 6.83% during 2026-2034. This growth trajectory is underpinned by several converging forces, including the Genomics Health Futures Mission which allocates substantial public funding for translational genomic research, the Therapeutic Goods Administration’s (TGA) adaptive approval pathways that are fast-tracking innovative diagnostic platforms to market, and landmark programs such as PrOSPeCT which offers 23,000 patients free genomic testing funded by USD 185 million. The establishment of a Medicare reimbursement rate of USD 3,200 for genomic panels covering 324 genes in January 2025 has eliminated prior-authorisation barriers, streamlining clinical adoption. The broader in-vitro diagnostics market, worth USD 2.06 billion in 2026 and growing at 5.02% CAGR, provides the ecosystem within which molecular diagnostics is the fastest-growing subsegment. The Australia and New Zealand PCR systems market alone reached USD 121.19 million in 2025 with an 8.40% CAGR trajectory, while NGS is growing at 12.21% CAGR as national cancer genomics frameworks embed high-throughput sequencing into standard care. The convergence of government investment, reimbursement reform, technological innovation, and an ageing population requiring earlier and more precise disease detection is creating a structurally favourable environment for sustained market expansion.

Request for a sample copy of this report: https://www.imarcgroup.com/australia-molecular-diagnostics-market/requestsample

How AI is Reshaping the Future of the Australia Molecular Diagnostics Market

Artificial intelligence is fundamentally transforming the Australian molecular diagnostics landscape, enhancing analytical accuracy, accelerating turnaround times, and enabling the interpretation of increasingly complex genomic datasets at clinical scale. As molecular testing generates exponentially larger volumes of sequencing and biomarker data, AI is becoming indispensable for extracting actionable clinical insights. Key developments include:

  • AI-Powered Variant Interpretation in NGS: Next-generation sequencing platforms produce vast quantities of genomic data that require sophisticated computational analysis to identify clinically significant variants. AI and machine learning algorithms are being deployed across Australian pathology laboratories to automate variant calling, classification, and prioritisation, dramatically reducing the time required for genomic analysis from days to hours while improving consistency and reducing interpretive variability between pathologists. This is particularly critical as programs like PrOSPeCT scale genomic testing to thousands of cancer patients.
  • Machine Learning in Liquid Biopsy Analysis: AI models are enhancing the sensitivity and specificity of liquid biopsy assays, which detect circulating tumour DNA (ctDNA) and other molecular biomarkers from simple blood draws. By training on large datasets of known cancer genomic profiles, machine learning systems can identify ultra-low-frequency mutations that conventional analysis methods would miss, enabling earlier cancer detection, minimal residual disease monitoring, and real-time treatment response assessment without invasive tissue biopsies.
  • Predictive Analytics for Infectious Disease Surveillance: AI-driven predictive models are being integrated with molecular diagnostic platforms across Australian public health laboratories to forecast infectious disease outbreaks, track pathogen evolution, and identify antimicrobial resistance patterns. By correlating real-time PCR and sequencing data with epidemiological indicators, these systems enable earlier public health interventions and more targeted antimicrobial stewardship, reducing the burden on healthcare infrastructure.
  • Automated Digital Pathology Workflows: AI is transforming digital pathology by automating the analysis of molecular test results alongside histological imaging, creating integrated diagnostic workflows that combine morphological assessment with molecular biomarker profiles. Australian pathology providers are deploying AI-assisted platforms that correlate molecular diagnostic results with digital slide images, improving diagnostic confidence and enabling more comprehensive tumour characterisation for precision oncology treatment planning.
  • AI-Optimised Point-of-Care Testing: Artificial intelligence is enabling the development of smarter point-of-care molecular diagnostic devices that can deliver laboratory-quality results in decentralised settings. AI algorithms embedded in portable PCR and isothermal amplification devices provide real-time quality control, automated result interpretation, and connectivity to centralised laboratory information systems, expanding molecular testing access to rural and remote Australian communities where centralised laboratory services are limited.

Australia Molecular Diagnostics Market Trends

Precision Oncology Driving Genomic Testing Integration into Standard Care

The Australia molecular diagnostics market is being reshaped by the systematic integration of genomic testing into standard oncology care pathways, transitioning molecular diagnostics from a specialised research tool to a routine clinical requirement. The PrOSPeCT program, which offers 23,000 patients free genomic testing funded by USD 185 million, represents a landmark initiative that demonstrates how coordinated policy, clinical trial access, and coverage decisions can democratise precision oncology. Medicare’s establishment of a USD 3,200 reimbursement rate for 324-gene panels in January 2025 has removed a critical financial barrier, enabling broader adoption across public and private healthcare settings. The cancer biomarkers market in Australia, valued at USD 785.47 million in 2025 and projected to reach USD 2,875.76 million by 2034 at a 13.82% CAGR, underscores the scale of growth in oncology-driven molecular testing. Next-generation sequencing is growing at a 12.21% CAGR as national cancer genomics frameworks and Medical Services Advisory Committee (MSAC) reimbursement endorsements embed high-throughput sequencing into standard care protocols. Liquid biopsy technologies are further accelerating this trend by enabling non-invasive molecular profiling for treatment selection, resistance monitoring, and minimal residual disease detection, creating recurring testing revenue streams that support sustained market growth.

Decentralised Testing and Point-of-Care Molecular Diagnostics Expansion

The proliferation of point-of-care molecular diagnostic platforms is emerging as a transformative trend in the Australian market, driven by the need to extend rapid, high-accuracy testing capabilities beyond centralised laboratory settings. Australia’s vast geography and dispersed rural populations create unique challenges for timely diagnostic access, making decentralised molecular testing a healthcare imperative rather than a mere convenience. Portable and near-patient PCR, isothermal amplification, and digital PCR devices are being deployed across emergency departments, general practice clinics, remote health centres, and aged care facilities, enabling rapid diagnosis of infectious diseases, sepsis, and sexually transmitted infections without the delays inherent in specimen transport to centralised laboratories. The TGA’s approval of QIAGEN’s QIAcuityDx digital PCR system in November 2024, with processing speeds as fast as two hours, exemplifies the technological advancement enabling clinical-grade molecular testing at the point of care. Similarly, the TGA approval of Immunexpress’s SeptiCyte RAPID test addresses a critical clinical need in managing Australia’s estimated 90,000 annual sepsis cases, which impose approximately AUD 4 billion in total healthcare costs. This decentralisation trend is supported by laboratory automation initiatives that integrate point-of-care results with central laboratory information systems, maintaining quality assurance and data continuity while dramatically improving time-to-result for clinically urgent molecular tests.

Australia Molecular Diagnostics Market Summary

  • Market Valuation: The Australia molecular diagnostics market reached USD 625.6 Million in 2025 and is expected to reach USD 1,153.8 Million by 2034 at a CAGR of 6.83% during 2026-2034.
  • Precision Oncology Funding: The PrOSPeCT program offers 23,000 patients free genomic testing funded by USD 185 million, while Medicare established a USD 3,200 reimbursement rate for 324-gene panels in January 2025.
  • Cancer Biomarkers Growth: The Australian cancer biomarkers market was valued at USD 785.47 Million in 2025 and is projected to reach USD 2,875.76 Million by 2034 at a 13.82% CAGR, driving demand for oncology molecular diagnostics.
  • PCR Systems Expansion: The Australia and New Zealand PCR systems market reached USD 121.19 Million in 2025 with an 40% CAGR, while NGS is growing at 12.21% CAGR as genomic sequencing embeds into standard care.
  • Sepsis Diagnostics Impact: Australia records an estimated 90,000 annual sepsis cases imposing approximately AUD 4 billion in healthcare costs, driving demand for rapid molecular sepsis diagnostics including the TGA-approved SeptiCyte RAPID test.

Australia Molecular Diagnostics Market Growth Drivers

Rising Chronic Disease Burden and Ageing Population

Australia’s rising chronic disease burden, combined with an ageing population, is creating sustained structural demand for molecular diagnostic technologies that enable earlier detection, more precise risk stratification, and targeted therapeutic intervention. Cancer remains the leading cause of disease burden in Australia, with molecular diagnostics playing an increasingly central role in tumour profiling, companion diagnostic testing for targeted therapies, and monitoring treatment response through circulating biomarkers. Cardiovascular disease, diabetes, and neurodegenerative conditions are further expanding the clinical applications of molecular testing as precision medicine approaches move beyond oncology into broader disease management. The ageing demographic profile amplifies this driver, as older Australians face disproportionately higher incidence rates of cancer, infectious disease susceptibility, and genetic conditions requiring molecular characterisation. The Genomics Health Futures Mission provides critical public funding for translational genomic research that bridges the gap between laboratory discovery and clinical implementation, while the TGA’s adaptive approval pathways are accelerating the availability of innovative molecular diagnostic platforms to Australian clinicians. This convergence of demographic pressure, clinical need, government investment, and regulatory facilitation is creating a durable growth foundation for the molecular diagnostics market that is largely insulated from economic cyclicality.

Technological Advancement in Sequencing and Digital PCR Platforms

Rapid technological advancement in molecular diagnostic platforms is a fundamental growth driver, as next-generation sequencing, digital PCR, and isothermal amplification technologies deliver progressively higher sensitivity, faster turnaround times, and lower per-test costs that expand the addressable clinical applications. The inclusion of QIAGEN’s QIAcuityDx digital PCR system in the Australian Register of Therapeutic Goods in November 2024 exemplifies this trend, offering absolute quantitation of low-abundance DNA and RNA targets with processing speeds as fast as two hours, supporting applications in oncology liquid biopsies, BCR::ABL monitoring for leukaemia, and infectious disease detection. NGS platform costs continue to decline while throughput increases, enabling comprehensive genomic profiling panels covering hundreds of genes to be delivered within clinically actionable timeframes. The partnership between Abacus dx and Roche for distribution of LightCycler 96, LightCycler 480 II, and MagNA Pure 24 systems in June 2024 reflects the ongoing infrastructure buildout that is making advanced molecular platforms accessible across the Australian laboratory network. Bioinformatics capabilities are advancing in parallel, with AI-powered analytical tools enabling the extraction of clinically meaningful insights from complex sequencing datasets that would be impractical to interpret manually. This technology-driven expansion of diagnostic capability is creating new clinical use cases, improving patient outcomes through earlier and more precise diagnosis, and generating recurring revenue streams from longitudinal monitoring applications.

Australia Molecular Diagnostics Market Segments

The Australia molecular diagnostics market encompasses a diverse range of products, technologies, and clinical applications, reflecting the broad and expanding utility of molecular testing across the healthcare system. Key segment breakdowns include:

  • By Product: The market is segmented into reagents and kits, instruments, and software and services. Reagents and kits represent the largest recurring revenue stream, driven by high-volume PCR and sequencing consumables. Instruments encompass PCR thermal cyclers, NGS platforms, and digital PCR systems, while software and services include bioinformatics analysis tools, laboratory information management systems, and technical support contracts.
  • By Technology: Key technology segments include polymerase chain reactions (PCR), hybridization, DNA sequencing, microarray, isothermal nucleic acid amplification technology (INAAT), and others. PCR remains the workhorse technology with the Australia-New Zealand market reaching USD 121.19 million in 2025, while NGS is the fastest-growing segment at 12.21% CAGR driven by oncology genomic profiling and comprehensive gene panel testing.
  • By Application: The market serves infectious diseases diagnostics, oncology, genetic testing, blood screening, and other applications. Oncology is the primary growth engine, supported by the PrOSPeCT program and Medicare reimbursement for genomic panels, while infectious disease diagnostics maintains strong baseline demand from surveillance programmes and point-of-care testing initiatives.
  • By End User: The market spans hospitals, laboratories, and other end users including research institutions and public health agencies. Pathology laboratories represent the institutional core of the market, with Sonic Healthcare, Healius, and Australian Clinical Labs collectively dominating the AUD 5.7 billion pathology services sector and driving molecular testing adoption across their national networks.
  • By Region: The market spans Australian Capital Territory and New South Wales, Victoria and Tasmania, Queensland, Northern Territory and South Australia, and Western Australia. New South Wales and Victoria lead market concentration, anchored by major teaching hospitals, university research centres, and the headquarters of the largest pathology service providers.

Australia Molecular Diagnostics Market Competitive Landscape

The Australia molecular diagnostics market features a competitive landscape combining global diagnostic technology leaders with innovative domestic companies specialised in niche molecular testing applications. F. Hoffmann-La Roche AG maintains a dominant market position through its comprehensive portfolio of PCR systems, sequencing reagents, and oncology companion diagnostics, with its LightCycler and MagNA Pure platforms distributed through Abacus dx across the Australian market. Abbott Laboratories leverages its Alinity m and m2000 molecular platforms for high-throughput infectious disease and blood screening applications across major hospital and reference laboratories. QIAGEN N.V. strengthened its Australian presence with TGA registration of its QIAcuityDx digital PCR system in November 2024, targeting oncology and infectious disease markets. Among domestic competitors, Sonic Healthcare, Australia’s largest pathology provider, drives molecular testing adoption through its Sonic Genetics division and national laboratory network. Genetic Signatures Ltd. and SpeeDx Pty Ltd are Australian-founded companies delivering innovative multiplex molecular testing platforms for infectious diseases and antimicrobial resistance. AusDiagnostics provides automated syndromic testing panels, while Immunexpress has secured TGA approval for its SeptiCyte RAPID sepsis diagnostic. Other significant participants include Bio-Rad Laboratories, Hologic, Inc., Promega Corporation, and MOL Diagnostics, collectively contributing to a market characterised by technological innovation, regulatory engagement, and strategic partnerships across the diagnostic value chain.

Australia Molecular Diagnostics Market Latest News & Development

  • February 2025: Immunexpress presented new clinical data on its SeptiCyte RAPID test, a TGA-approved molecular diagnostic for sepsis management, addressing Australia’s estimated 90,000 annual sepsis cases that impose approximately AUD 4 billion in total healthcare costs, enabling faster clinical decision-making in emergency department settings.
  • January 2025: Medicare established a reimbursement rate of USD 3,200 for genomic panels covering 324 genes, eliminating prior-authorisation delays and streamlining access to comprehensive molecular profiling for cancer patients across public and private healthcare settings in Australia.
  • November 2024: QIAGEN announced the inclusion of its QIAcuityDx digital PCR system in the Australian Register of Therapeutic Goods (ARTG), supporting oncology applications including liquid biopsies and BCR::ABL monitoring with processing speeds as fast as two hours, expanding digital PCR capabilities across Australian clinical laboratories.
  • June 2024: Abacus dx partnered with Roche for Life Science product distribution in Australia, providing access to LightCycler 96, LightCycler 480 II, and MagNA Pure 24 systems alongside sequencing reagents, strengthening the molecular diagnostics infrastructure available to Australian laboratories.
  • 2025: Australia’s PrOSPeCT program continued scaling, offering 23,000 patients free genomic testing funded by USD 185 million, demonstrating how coordinated policy, clinical trial access, and reimbursement decisions can democratise precision oncology across the national healthcare system.

Note: If you require any specific information not currently covered within the scope of the report, IMARC Group will provide it as part of customization.
Speak to an analyst:

https://www.imarcgroup.com/request?type=report&id=34017&flag=E